
개요
This chapter covers Performance-tuning the control plane
- 컨트롤 플레인 성능에 영향을 미치는 요소 이해하기 Understanding the factors of control-plane performance
- 성능 모니터링 방법 알아보기 How to monitor performance
- 주요 성능 메트릭 알아보기 What are the key performance metrics
- 성능 최적화 방법 이해하기 Understanding how to optimize performance
- 들어가며 : 컨트롤 플레인 성능 최적화
- 데이터 플레인 문제 해결을 다룬 앞 장에서는 프록시 설정 및 동작 문제를 진단하는 데 사용할 수 있는 디버깅 도구를 자세히 살펴봤다.
- 서비스 프록시 설정을 이해하면 예상과 다를 때 문제를 해결하는 것이 간단해진다.
- 이번 장에서는 컨트롤 플레인 성능 최적화에 초점을 맞춘다.
- 컨트롤 플레인이 어떻게 서비스 프록시를 설정하는지, 이 과정을 느리게 만드는 요인이 무엇인지, 이 과정을 어떻게 모니터링하는지, 성능을 향상시키기 위해 조정할 수 있는 변수는 무엇인지 등을 알아본다.
[실습 환경 구성] k8s(1.23.17) 배포 : NodePort(30000 HTTP, 30005 HTTPS)
#
git clone https://github.com/AcornPublishing/istio-in-action
cd istio-in-action/book-source-code-master
pwd # 각자 자신의 pwd 경로
code .

# 아래 extramounts 생략 시, myk8s-control-plane 컨테이너 sh/bash 진입 후 직접 git clone 가능
kind create cluster --name myk8s --image kindest/node:v1.23.17 --config - <<EOF
kind: Cluster
apiVersion: kind.x-k8s.io/v1alpha4
nodes:
- role: control-plane
  extraPortMappings:
  - containerPort: 30000 # Sample Application (istio-ingrssgateway) HTTP
    hostPort: 30000
  - containerPort: 30001 # Prometheus
    hostPort: 30001
  - containerPort: 30002 # Grafana
    hostPort: 30002
  - containerPort: 30003 # Kiali
    hostPort: 30003
  - containerPort: 30004 # Tracing
    hostPort: 30004
  - containerPort: 30005 # Sample Application (istio-ingrssgateway) HTTPS
    hostPort: 30005
  - containerPort: 30006 # TCP Route
    hostPort: 30006
  - containerPort: 30007 # kube-ops-view
    hostPort: 30007
  extraMounts: # 해당 부분 생략 가능
  - hostPath: /root/istio_gasida/istio-in-action/book-source-code-master # 각자 자신의 pwd 경로로 설정
    containerPath: /istiobook
networking:
  podSubnet: 10.10.0.0/16
  serviceSubnet: 10.200.1.0/22
EOF

# 설치 확인
docker ps

# 노드에 기본 툴 설치
docker exec -it myk8s-control-plane sh -c 'apt update && apt install tree psmisc lsof wget bridge-utils net-tools dnsutils tcpdump ngrep iputils-ping git vim -y'

# (옵션) kube-ops-view
helm repo add geek-cookbook https://geek-cookbook.github.io/charts/
helm install kube-ops-view geek-cookbook/kube-ops-view --version 1.2.2 --set service.main.type=NodePort,service.main.ports.http.nodePort=30007 --set env.TZ="Asia/Seoul" --namespace kube-system
kubectl get deploy,pod,svc,ep -n kube-system -l app.kubernetes.io/instance=kube-ops-view

## kube-ops-view 접속 URL 확인
open "http://localhost:30007/#scale=1.5"
open "http://localhost:30007/#scale=1.3"

# (옵션) metrics-server
helm repo add metrics-server https://kubernetes-sigs.github.io/metrics-server/
helm install metrics-server metrics-server/metrics-server --set 'args[0]=--kubelet-insecure-tls' -n kube-system
kubectl get all -n kube-system -l app.kubernetes.io/instance=metrics-server
[실습 환경 구성] istio 1.17.8 설치 - Docs , Install , profile
# myk8s-control-plane 진입 후 설치 진행
docker exec -it myk8s-control-plane bash
-----------------------------------
# (옵션) 코드 파일들 마운트 확인
tree /istiobook/ -L 1
혹은
git clone ... /istiobook

# istioctl 설치
export ISTIOV=1.17.8
echo 'export ISTIOV=1.17.8' >> /root/.bashrc

curl -s -L https://istio.io/downloadIstio | ISTIO_VERSION=$ISTIOV sh -
cp istio-$ISTIOV/bin/istioctl /usr/local/bin/istioctl
istioctl version --remote=false

# demo 프로파일 컨트롤 플레인 배포
istioctl install --set profile=demo --set values.global.proxy.privileged=true --set meshConfig.accessLogEncoding=JSON -y

# 보조 도구 설치
kubectl apply -f istio-$ISTIOV/samples/addons

# 빠져나오기
exit
-----------------------------------

# 설치 확인 : istiod, istio-ingressgateway, crd 등
kubectl get istiooperators -n istio-system -o yaml
kubectl get all,svc,ep,sa,cm,secret,pdb -n istio-system
kubectl get cm -n istio-system istio -o yaml
kubectl get crd | grep istio.io | sort

# 실습을 위한 네임스페이스 설정
kubectl create ns istioinaction
kubectl label namespace istioinaction istio-injection=enabled
kubectl get ns --show-labels

# istio-ingressgateway 서비스 : NodePort 변경 및 nodeport 지정 변경 , externalTrafficPolicy 설정 (ClientIP 수집)
kubectl patch svc -n istio-system istio-ingressgateway -p '{"spec": {"type": "NodePort", "ports": [{"port": 80, "targetPort": 8080, "nodePort": 30000}]}}'
kubectl patch svc -n istio-system istio-ingressgateway -p '{"spec": {"type": "NodePort", "ports": [{"port": 443, "targetPort": 8443, "nodePort": 30005}]}}'
kubectl patch svc -n istio-system istio-ingressgateway -p '{"spec":{"externalTrafficPolicy": "Local"}}'
kubectl describe svc -n istio-system istio-ingressgateway

# NodePort 변경 및 nodeport 30001~30003으로 변경 : prometheus(30001), grafana(30002), kiali(30003), tracing(30004)
kubectl patch svc -n istio-system prometheus -p '{"spec": {"type": "NodePort", "ports": [{"port": 9090, "targetPort": 9090, "nodePort": 30001}]}}'
kubectl patch svc -n istio-system grafana -p '{"spec": {"type": "NodePort", "ports": [{"port": 3000, "targetPort": 3000, "nodePort": 30002}]}}'
kubectl patch svc -n istio-system kiali -p '{"spec": {"type": "NodePort", "ports": [{"port": 20001, "targetPort": 20001, "nodePort": 30003}]}}'
kubectl patch svc -n istio-system tracing -p '{"spec": {"type": "NodePort", "ports": [{"port": 80, "targetPort": 16686, "nodePort": 30004}]}}'

# Prometheus 접속 : envoy, istio 메트릭 확인
open http://127.0.0.1:30001

# Grafana 접속
open http://127.0.0.1:30002

# Kiali 접속 1 : NodePort
open http://127.0.0.1:30003

# (옵션) Kiali 접속 2 : Port forward
kubectl port-forward deployment/kiali -n istio-system 20001:20001 &
open http://127.0.0.1:20001

# tracing 접속 : 예거 트레이싱 대시보드
open http://127.0.0.1:30004
11.1 컨트롤 플레인의 주요 목표
들어가며 : 유령 워크로드와 대응 방안
- 이번 장에서 컨트롤 플레인은 서비스 메시의 두뇌이며 서비스 메시 운영자를 위해 API를 노출한다고 했었다.
- 이 API를 사용하면, 메시의 동작을 조작하고 각 워크로드 인스턴스에 함께 배포된 서비스 프록시를 설정할 수 있다.
- 간결함을 위해 앞서 생략했던 내용이 있는데, 서비스 메시 운영자(즉, 우리)가 이 API에 요청을 하는 것이 메시의 동작과 설정에 영향을 미치는 유일한 방법은 아니라는 점이다.
- 좀 더 일반적으로 말하면 컨트롤 플레인은 런타임 환경의 세부적인 내용들을 추상화하는데, 어떤 서비스가 존재하는지(서비스 디스커버리), 어떤 서비스가 정상인지와 오토스케일링 이벤트 등이 해당된다.
- 이스티오의 컨트롤 플레인은 쿠버네티스의 이벤트를 수신하고, 원하는 새 상태를 반영하고자 설정을 업데이트한다.
- 이 상태 조정 절차는 올바르게 동작하는 메시를 유지하기 위해 계속되며, 시기적절하게 일어나는 것이 중요하다.
- 컨트롤 플레인이 상태 조정 절차를 적시에 하지 못할 때마다 예기치 못한 결과로 이어지는데, 워크로드는 이미 바뀐 상태로 설정돼 있기 때문이다.
- 성능 저하될 때 발생하는 흔한 증상을 ‘유령 워크로드 phantom workload’ 라고 하는데, 이미 사라진 엔드포인트로 트래픽을 라우팅하도록 서비스가 설정돼 있으므로 요청이 실패한다.
- 그림 11.1은 유령 워크로드의 개념을 보여준다.
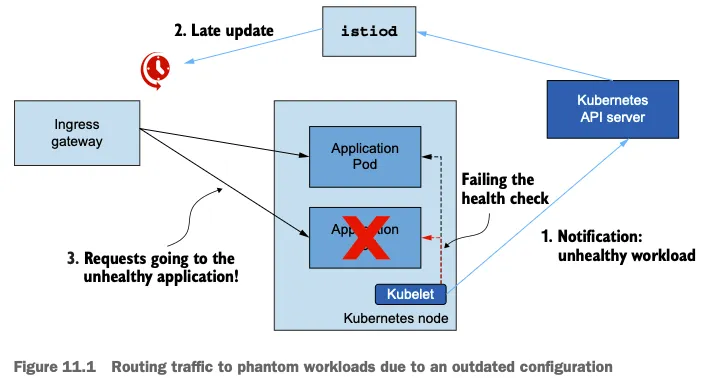
- 비정상이 된 워크로드가 이벤트를 트리거한다.
- 업데이트가 지연되면 서비스가 낡은 설정을 지니게 된다.
- 오래된? 설정 때문에 서비스가 트래픽이 존재하지 않은 워크로드로 라우팅한다.
- 데이터 플레인의 궁극적 일관성 eventually consistent 성질 덕분에 설정이 잠깐 낡은 것은 그리 문제가 되지 않는다.
- 다른 보호 기체를 사용할 수 있기 때문이다. as other protective mechanisms can be employed.
- 예를 들어 네트워크 문제로 요청이 실패하면 요청은 기본적으로 두 번 재시도되므로, 아마도 다른 정상 엔드포인트가 처리할 것이다.
- 또 다른 교정 방법으로는 이상값 감지가 있는데, 엔드포인트로 보낸 요청이 실패했을 때 클러스터에서 엔드포인트를 배제하는 것이다.
- 그러나 지연이 몇 초를 넘어가면 최종 사용자에게 부정적인 영향을 미칠 수 있으므로 반드시 피해야 한다.
- 이 장에서는 바로 이 내용을 주로 다룬다.
11.1.1 데이터 플레인 동기화 단계 이해하기 Understanding the steps of data-plane synchronization : 디바운스와 스로틀링
- 데이터 플레인을 원하는 상태로 동기화하는 과정은 여러 단계로 수행된다.
- 컨트롤 플레인은 쿠버네티스에서 이벤트를 수신한다.
- 이벤트는 엔보이 설정으로 변환돼 데이터 플레인의 서비스 프록시로 푸시된다.
- 이 과정을 이해하면 컨트롤 플레인 성능을 미세 조정하고 최적화할 때 이뤄지는 의사결정에 도움이 된다.
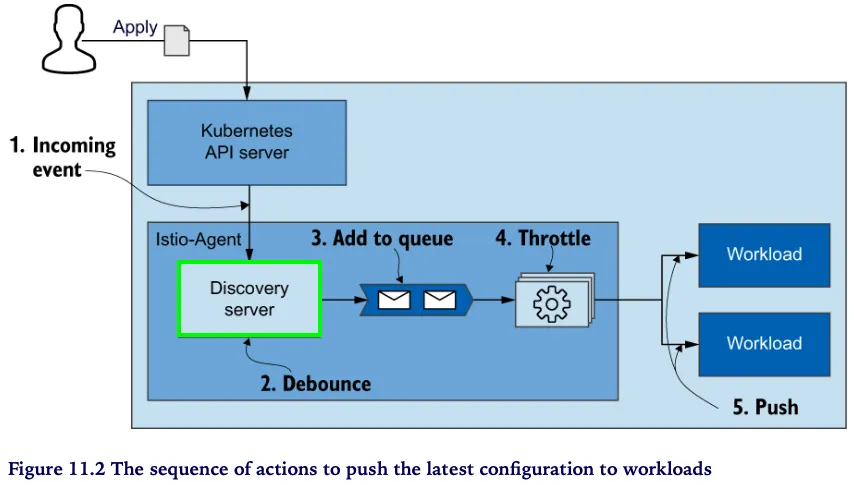
- 그림 11.2는 들어오는 변경 사항에 맞춰 데이터 플레인을 동기화하는 단계를 순서대로 보여준다.
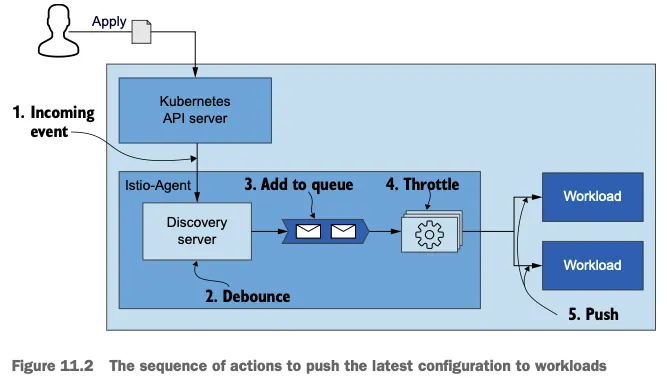
- 들어오는 이벤트가 동기화 과정을 시작한다. An incoming event triggers the synchronization process.
- istiod 의 DiscoveryServer 구성 요소가 이 이벤트들을 수신한다. The DiscoveryServer component of istiod listens for these events.
- 성능을 향상시키기 위해, 푸시 대기열에 이벤트를 추가하는 작업을 일정 시간 미루고 그 동안의 후속 이벤트를 병합해 일괄 처리한다.
- 이를 ‘디바운스 debounce 한다’고 말하는데, 디바운스는 시간을 잡아먹는 작업이 너무 자주 실행되지 않도록 해준다.
- 지연 시간이 만료되면, DiscoveryServer가 병합된 이벤트를 푸시 대기열에 추가한다. 푸시 대기열은 처리 대기 중인 푸시 목록을 유지 관리한다.
- After the delay period expires, the DiscoveryServer adds the merged events to the push queue, which maintains a list of pushes waiting to be processed.
- istiod 서버는 동시에 처리되는 푸시 요청 개수를 제한 throttle 하는데, 이는 처리 중인 항목이 더 빨리 처리되도록 보장하고 CPU 시간이 작업 간 콘텍스트 스위칭에 낭비되는 것을 방지한다. The istiod server throttles (limits) the number of push requests that are processed concurrently, which ensures that faster progress is made on the items being processed and prevents CPU time from being wasted on context switching between the tasks.
- 처리된 항목은 엔보이 설정으로 변환돼 워크로드로 푸시된다. The items that are processed are converted to Envoy configuration and pushed to the workloads.
- 여기서는 이스티오가 디바운스(디바운싱 debouncing)와 스로틀링 throttling 이라는 두 가지 방법을 사용해 과부하되지 않도록 스스로를 보호하는 방법을 다룬다.
- 추후 살펴보겠지만 디바운스와 스로틀링은 성능을 향상시키기 위해 설정할 수 있는 것이다.
11.1.2 성능을 결정짓는 요소 Factors that determine performance : 변경 속도, 할당된 리소스, 업데이트할 워크로드 개수, 설정 크기
동기화 프로세스를 잘 이해하면, 컨트롤 플레인의 성능에 영향을 미치는 요소를 자세히 설명할 수 있다. (그림 11.3 참조)
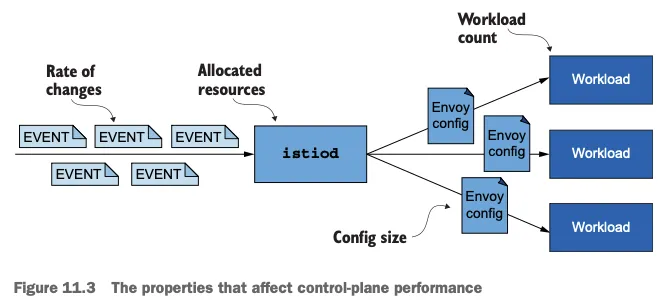
- 변경 속도 The rate of changes
- 변경 속도가 빠를수록 데이터 플레인을 동기화 상태로 유지하는 데 더 많은 처리가 필요하다. A higher rate of changes requires more processing to keep the data plane synchronized.
- 할당된 리소스 Allocated resources
- 수요가 istiod에 할당된 리소스를 넘어서면 작업을 대기열에 넣어야하므로 업데이트 배포가 느려진다. If the demand exceeds the resources allocated to istiod, work has to be queued, which results in a slower distribution of updates.
- 업데이트할 워크로드 개수 Number of workloads to update
- 더 많은 워크로드에 업데이트를 배포하려면 네트워크 대역폭과 처리 능력이 더 많이 필요하다. More processing power and network bandwidth are required to distribute updates to more workloads.
- 설정 크기 Configuration size
- 더 큰 엔보이 구성을 배포하려면 처리 능력과 네트워크 대역폭이 더 많이 필요하다. The distribution of larger Envoy configurations requires more processing power and more network bandwidth.
- 이 요소들에 맞게 성능을 최적화하는 방법을 다룰 것이다.
- 그러니 그 전에 프로메테우스가 istiod에서 수집한 메트릭을 시각화한 그라파나 대시보드(8장에서 준비함)를 사용해 병목 지점을 판단하는 방법을 배워보자.
11.2 컨트롤 플레인 모니터링하기
들어가며 : Monitoring the control plane
- istiod는 핵심 성능 지표의 지속 시간 및 빈도를 측정하는 메트릭을 노출하는데, 여기에는 리소스 사용률, 수신 또는 발신 트래픽으로 인한 부하, 오류 비율 등이 있다.
- 이런 지표들은 제어 평면의 성능이 어떤지, 어떤 것이 곧 문제를 일으킬지, 이미 올바르게 동작하지 않는 것을 어떻게 트러블슈팅해야 하는지를 밝히는 데 도움을 준다.
- 노출되는 메트릭들은 이스티오 공식 문서에 기술돼 있는데, 메트릭 개수는 방대하다 - Docs
- 여기서는 주목해야 할 핵심 메트릭을 식별하고, 네 가지 황금 신호에 대략 맞도록 메트릭을 정리해볼 것이다.
11.2.1 컨트롤 플레인의 네 가지 황금 신호 The four golden signals of the control plane (실습~)
들어가며 : 실습 환경 초기화
- 구글 SRE 책에서 정의한 네 가지 황금 신호란 서비스가 어떻게 동작하는지에 대한 외부의 시각을 이해하기 위해 모니터링해야 하는 네 가지 주요 메트릭을 말한다.
- 특정 서비스가 자신의 서비스 수준 목표 SLO 에서 벗어난 경우, 황금 메트릭을 통해 원인을 분석하는 통찰력을 얻을 수 있다.
- 네 가지 신호는 지연 시간, 포화도, 오류, 트래픽이다.
- 컨트롤 플레인의 메트릭을 빠르게 살펴보려면 다음 명령어로 쿼리하면 된다.
# 실습 환경 준비
kubectl -n istioinaction apply -f services/catalog/kubernetes/catalog.yaml
kubectl -n istioinaction apply -f ch11/catalog-virtualservice.yaml
kubectl -n istioinaction apply -f ch11/catalog-gateway.yaml
# 확인
kubectl get deploy,gw,vs -n istioinaction
# 반복 설정 해두기
while true; do curl -s http://catalog.istioinaction.io:30000/items ; date "+%Y-%m-%d %H:%M:%S" ; sleep 1; echo; done
# 컨트롤 플레인 메트릭 확인
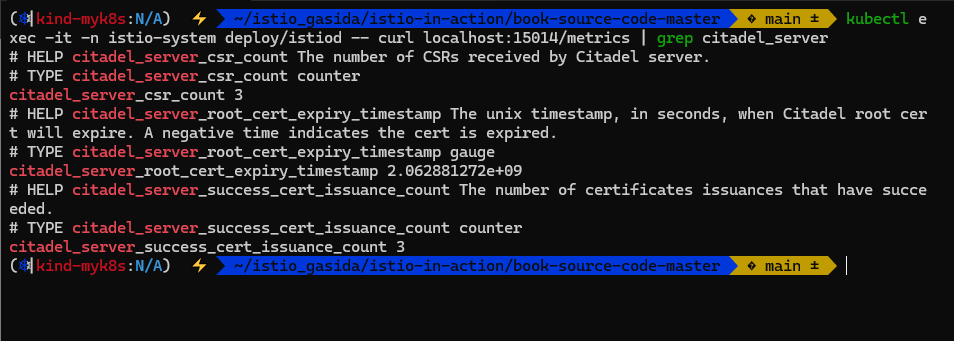
kubectl exec -it -n istio-system deploy/istiod -- curl localhost:15014/metrics
# HELP citadel_server_csr_count The number of CSRs received by Citadel server.
# TYPE citadel_server_csr_count counter
citadel_server_csr_count 3
...
이 장의 나머지 부분에서는 그라파나 대시보드로 이 메트릭들을 조사한다.
지연 시간: 데이터 플레인을 업데이트하는 데 필요한 시간 LATENCY: THE TIME NEEDED TO UPDATE THE DATA PLANE
- 지연 시간 신호를 사용하면 서비스가 어떻게 동작하는지를 서비스 외부의 최종 사용자 관점으로 알 수 있다.
- 지연 시간이 증가하면 서비스의 성능이 저하된 것이다. 그러나 성능 저하의 원인이 무엇인지는 알 수 없다.
- 원인을 알려면 다른 신호를 조사해야 한다.
- 이스티오 컨트롤 플레인에서 지연 시간은 컨트롤 플레인이 데이터 플레인에 업데이트를 얼마나 빠릴 배포하는지로 측정한다.
- 지연 시간을 측정하는 주요 메트릭은 pilot_proxy_convergence_time 이다.
- 그러나 동기화 절차 중 대부분의 시간을 소비하는 단계의 이해를 돕는 보조 메트릭도 두 가지 있는데, 하나는 pilot_proxy_queue_time 이고 다른 하나는 pilot_xds_push_time 이다.
- 그림 11.4는 동기화 단계 중 이 메트릭이 다루는 부분을 보여준다.
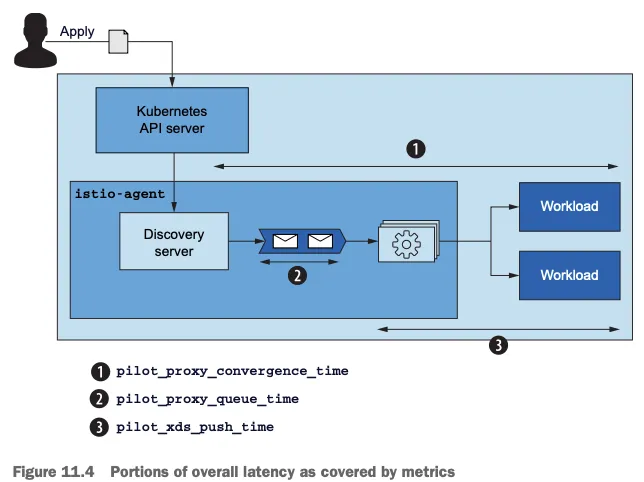
- pilot_proxy_convergence_time 은 프록시 푸시 요청이 대기열에 안착한 순간부터 워크로드에 배포되기까지 전체 과정의 지속 시간을 측정한다. measures the entire process’s duration from the time a proxy push request lands in the queue until it is distributed to the workloads.
- pilot_proxy_queue_time 은 워커가 처리할 때까지 푸시 요청이 대기열에서 기다린 시간을 측정한다. 푸시 대기열에서 상당한 시간이 걸리는 경우, istiod를 수직으로 확장해 동시 처리 능력을 높일 수 있다. measures the time the push requests wait in the queue until they are processed by a worker. If a considerable amount of time is spent in the push queue, we might scale istiod vertically and increase the concurrent processing power.
- pilot_xds_push_time 은 엔보이 설정을 워크로드로 푸시하는 데 필요한 시간을 측정한다. 시간이 늘어나면, 전송되는 데이터양 때문에 네트워크 대역폭이 과부하된 것이다. 설정 업데이트 크기와 워크로드별 변화 빈도를 줄임으로써 이 상황을 상당히 개선할 수 있는 방법을 뒷부분에서 살펴본다. measures the time required to push the Envoy configuration to workloads. An increase shows that network bandwidth is overloaded by the amount of data being transferred. We see in later sections how sidecars can considerably improve this situation by reducing the size of configuration updates and frequency of changes per proxy.
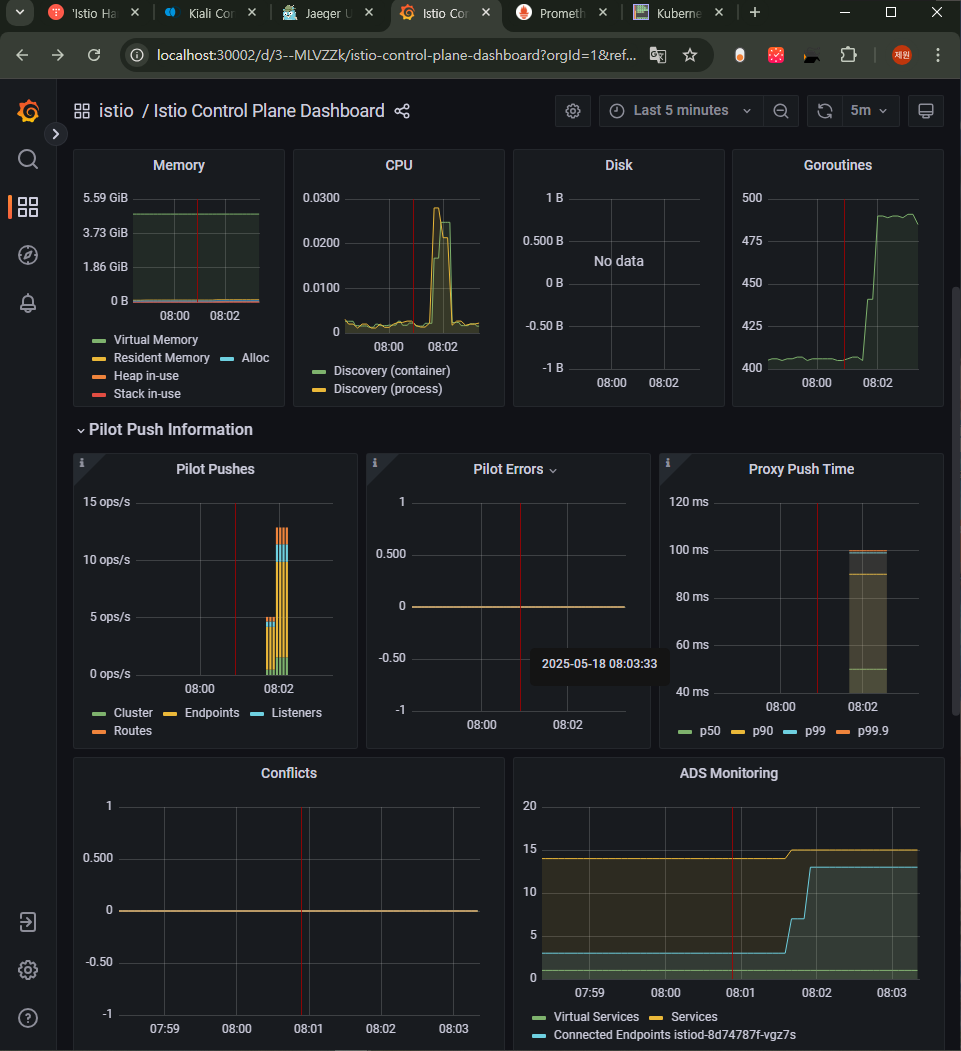
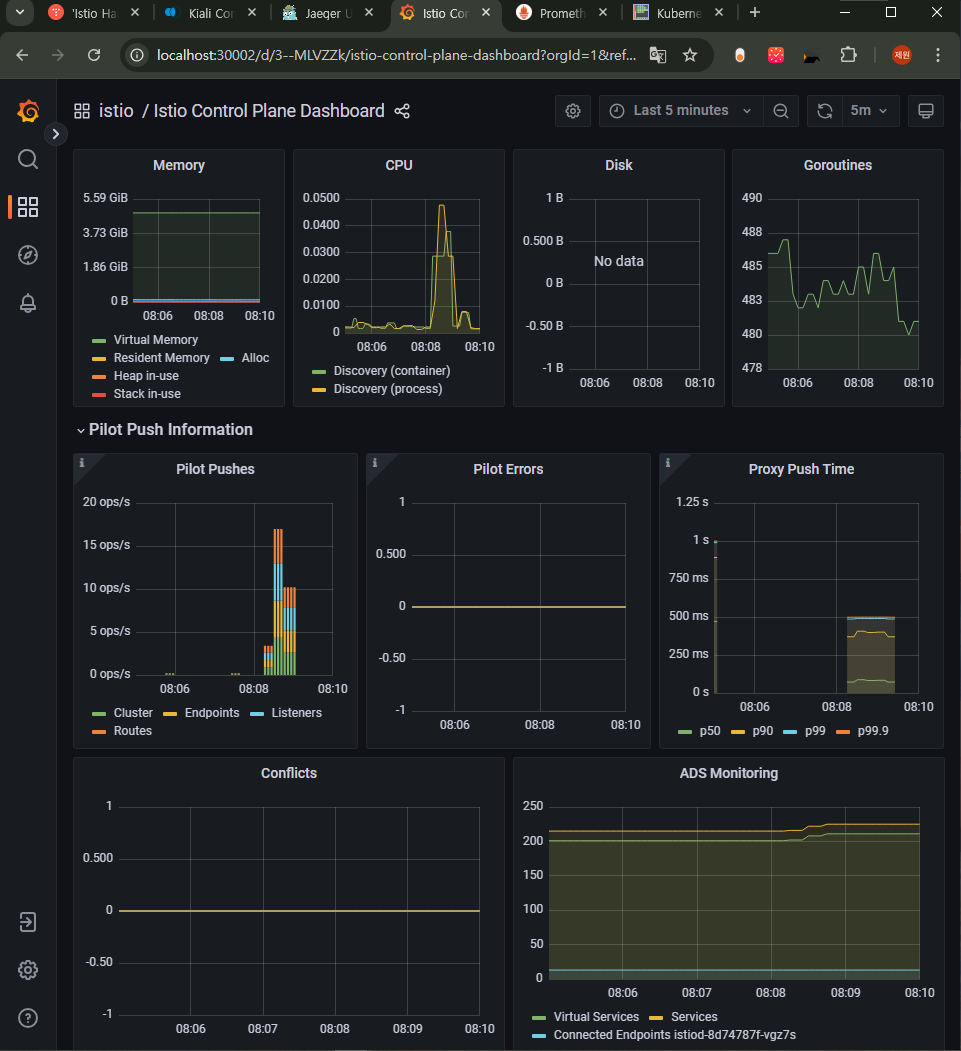
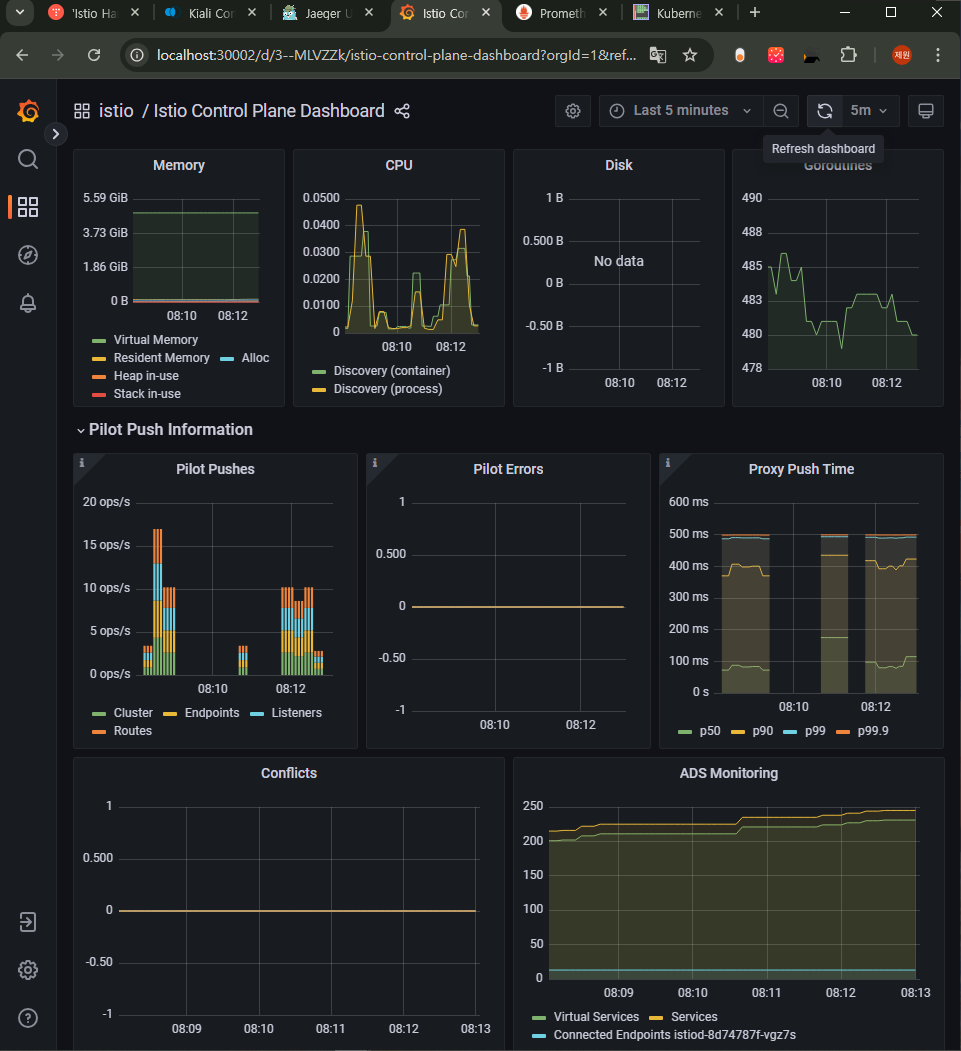
pilot_proxy_convergence_time 은 그라파나 대시보드에서 시각화하고 있는데, Istio Control Plane 대시보드의 Proxy Push Time이라는 Pilot Push 정보 부분에 있다.
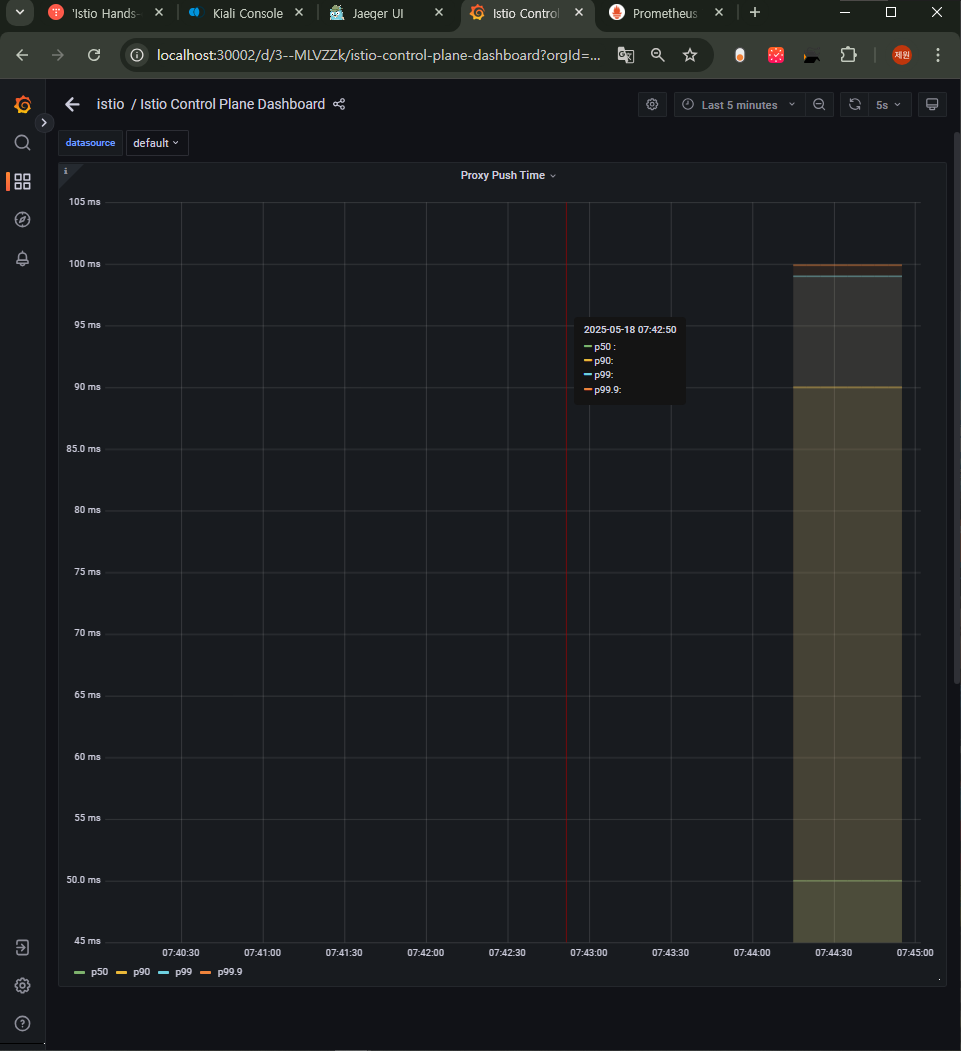
위 그래프는 푸시의 99.9%는 워크로드에 배포하는 데 걸리는 시간이 100ms 미만임. 이상적이다!
histogram_quantile(0.5,   sum(rate(pilot_proxy_convergence_time_bucket[1m])) by (le))
histogram_quantile(0.9,   sum(rate(pilot_proxy_convergence_time_bucket[1m])) by (le))
histogram_quantile(0.99,  sum(rate(pilot_proxy_convergence_time_bucket[1m])) by (le))
histogram_quantile(0.999, sum(rate(pilot_proxy_convergence_time_bucket[1m])) by (le))
(참고) 프로메테우스 쿼리 : le (누적 카운트) “less than or equal”
pilot_proxy_convergence_time_bucket
# le="0.1": 0.1초 이하로 동기화 완료된 프록시가 10개
# le="1": 1초 이하로 완료된 프록시가 누적 20개
# le="+Inf": 모든 프록시 포함 → 누적 41개
...

pilot_proxy_convergence_time_bucket[1m]
rate(pilot_proxy_convergence_time_bucket[1m])
sum(rate(pilot_proxy_convergence_time_bucket[1m]))
sum(rate(pilot_proxy_convergence_time_bucket[1m])) by (le)

histogram_quantile(0.5, sum(rate(pilot_proxy_convergence_time_bucket[1m])) by (le))
histogram_quantile(0.9, sum(rate(pilot_proxy_convergence_time_bucket[1m])) by (le))
...
그라파나 대시보드에 2개의 패널(메트릭) 추가 하자

대시보드 편집 설정
기존 Proxy Push Time 패널 복제 하기
Proxy Queue Time : PromQL - pilot_proxy_queue_time
histogram_quantile(0.5, sum(rate(pilot_proxy_queue_time_bucket[1m])) by (le))
histogram_quantile(0.9, sum(rate(pilot_proxy_queue_time_bucket[1m])) by (le))
histogram_quantile(0.99, sum(rate(pilot_proxy_queue_time_bucket[1m])) by (le))
histogram_quantile(0.999, sum(rate(pilot_proxy_queue_time_bucket[1m])) by (le))
XDS Push Time : PromQL - pilot_xds_push_time_bucket
histogram_quantile(0.5, sum(rate(pilot_xds_push_time_bucket[1m])) by (le))
histogram_quantile(0.9, sum(rate(pilot_xds_push_time_bucket[1m])) by (le))
histogram_quantile(0.99, sum(rate(pilot_xds_push_time_bucket[1m])) by (le))
histogram_quantile(0.999, sum(rate(pilot_xds_push_time_bucket[1m])) by (le))
패널 위치 취향에 따라 배치
- 메시에 워크로드를 추가하면 이런 다양한 메트릭에서 지연 시간이 서서히 증가한다.
- 이는 당연한 일이므로 약간 증가하는 것은 걱정하지 않아도 된다.
- 다만, 허용할 수 있는 임계값은 정의하고 지연 시간이 허용할 수 있는 한계를 넘어가면 얼럿을 트리거해야 한다.
- 다음 기준으로 임계값을 고려하는 것을 권장한다.
- Warning 심각도 severity : 10초 이상 동안 지연 시간이 1초를 초과하는 경우
- Critical 심각도 severity : 10초 이상 동안 지연 시간이 2초를 초과하는 경우
- 첫 번째 얼럿을 받았을 때는 겁 먹을 필요 없다. 단지 서비스 지연 시간이 증가했고 성능 최적화가 필요하다는 조치 요청일 뿐이다.
- 그러나 확인하지 않고 방치하면 성능이 더 저하돼 최종 사용자에게 영향을 미칠 것이다.
- 지연 시간이 늘어났다는 것은 컨트롤 플레인 성능이 저하됐음을 알리는 가장 좋은 지표이지만, 성능 저하 원인에 대한 정보를 더 주지는 않는다.
- 저하 원인을 알아보려면 다른 메트릭을 더 깊이 파고들어야 한다.
포화도: 컨트롤 플레인이 얼마나(CPU, MEM 리소스) 가득 차 있는가? SATURATION: HOW FULL IS THE CONTROL PLANE?
- 포화도 메트릭은 리소스 사용량을 보여준다. The saturation metrics show the capacity at which resources are being utilized.
- 사용률이 90% 이상이면 서비스는 포화된 것이거나 곧 포화된다. If utilization is over 90%, the service is saturated or about to become so.
- istiod가 포화되면 배포 업데이트가 느려진다. 푸시 요청이 대기열에서 더 오래 처리를 기다리기 때문이다. When istiod is saturated, the distribution updates slow down as push requests are queued for longer periods, waiting to be processed.
- 포화는 보통 가장 제한적인 리소스 때문에 일어난다. istiod는 CPU 집중적이므로, 보통은 CPU가 가장 먼저 포화된다. CPU 사용률을 측정한다.
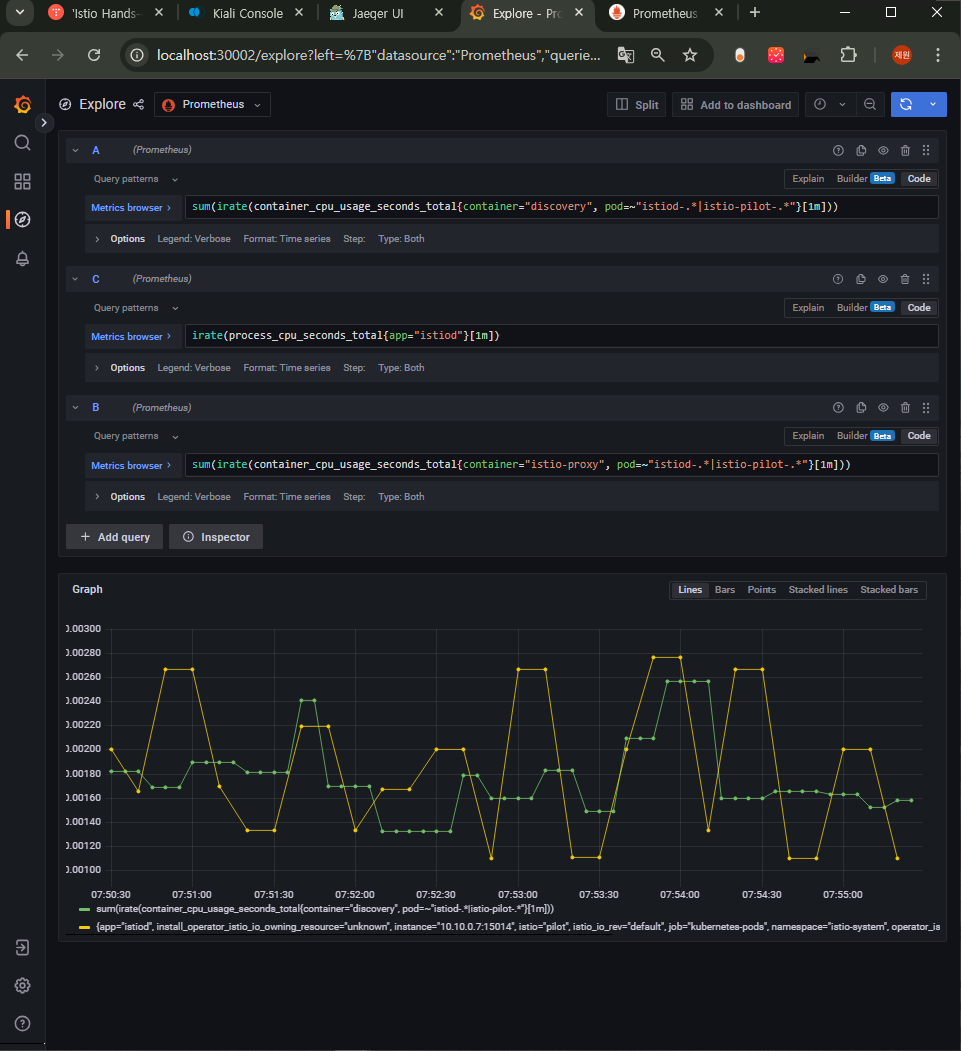
container_cpu_usage_seconds_total : 쿠버네티스 컨테이너가 보고하는 (istiod 파드) CPU 사용률을 측정한다 - Docs
# Cumulative cpu time consumed by the container in core-seconds
container_cpu_usage_seconds_total
container_cpu_usage_seconds_total{container="discovery"}
container_cpu_usage_seconds_total{container="discovery", pod=~"istiod-.*|istio-pilot-.*"}
sum(irate(container_cpu_usage_seconds_total{container="discovery", pod=~"istiod-.*|istio-pilot-.*"}[1m]))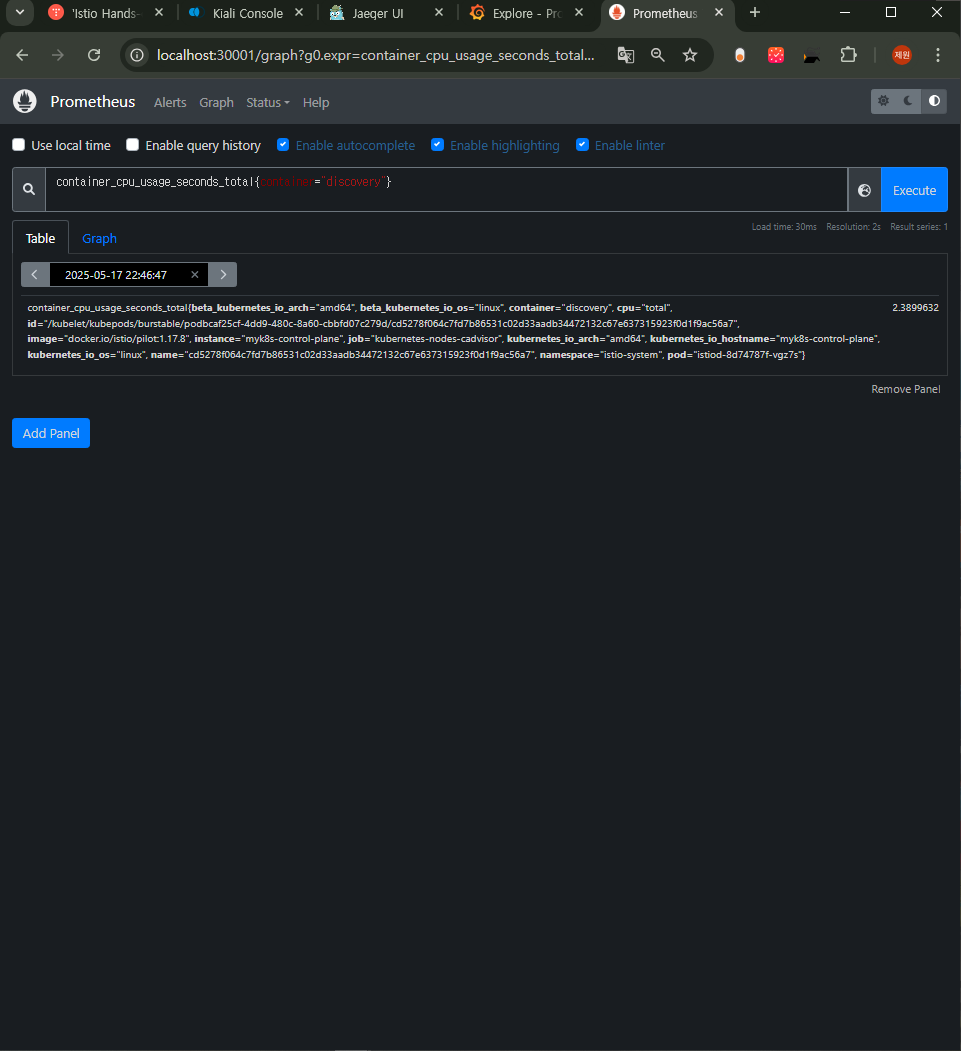
process_cpu_seconds_total : istiod 계측이 보고하는 (istiod 파드) CPU 사용률을 측정.
# Total user and system CPU time spent in seconds
process_cpu_seconds_total{app="istiod"}
irate(process_cpu_seconds_total{app="istiod"}[1m])
(참고) kubectl top 파드/컨테이너 리소스 사용 확인
kubectl top pod -n istio-system -l app=istiod --containers=true
POD                     NAME        CPU(cores)   MEMORY(bytes)
istiod-8d74787f-cqhs2   discovery   3m           62Mi

kubectl top pod -n istioinaction --containers=true
POD                      NAME          CPU(cores)   MEMORY(bytes)
catalog-6cf4b97d-5jtzt   catalog       0m           20Mi
catalog-6cf4b97d-5jtzt   istio-proxy   6m           46Mi

#
kubectl resource-capacity -n istioinaction -c -u -a
kubectl resource-capacity -n istioinaction -c -u
NODE                  POD                      CONTAINER     CPU REQUESTS   CPU LIMITS    CPU UTIL   MEMORY REQUESTS   MEMORY LIMITS   MEMORY UTIL
myk8s-control-plane   *                        *             10m (0%)       2000m (25%)   7m (0%)    40Mi (0%)         1024Mi (8%)     67Mi (0%)
myk8s-control-plane   catalog-6cf4b97d-5jtzt   *             10m (0%)       2000m (25%)   7m (0%)    40Mi (0%)         1024Mi (8%)     67Mi (0%)
myk8s-control-plane   catalog-6cf4b97d-5jtzt   catalog       0m (0%)        0m (0%)       0m (0%)    0Mi (0%)          0Mi (0%)        21Mi (0%)
myk8s-control-plane   catalog-6cf4b97d-5jtzt   istio-proxy   10m (0%)       2000m (25%)   7m (0%)    40Mi (0%)         1024Mi (8%)     47Mi (0%)

#
kubectl get pod -n istio-system -l istio.io/rev=default
kubectl resource-capacity -n istio-system -c -u
kubectl resource-capacity -n istio-system -c -u -a -l istio.io/rev=default
kubectl resource-capacity -n istio-system -c -u -l istio.io/rev=default
NODE                  POD                                     CONTAINER     CPU REQUESTS   CPU LIMITS    CPU UTIL   MEMORY REQUESTS   MEMORY LIMITS   MEMORY UTIL
myk8s-control-plane   *                                       *             30m (0%)       4000m (50%)   27m (0%)   180Mi (1%)        2048Mi (17%)    164Mi (1%)
myk8s-control-plane   istio-egressgateway-85df6b84b7-m4699    *             10m (0%)       2000m (25%)   9m (0%)    40Mi (0%)         1024Mi (8%)     49Mi (0%)
myk8s-control-plane   istio-egressgateway-85df6b84b7-m4699    istio-proxy   10m (0%)       2000m (25%)   9m (0%)    40Mi (0%)         1024Mi (8%)     49Mi (0%)
myk8s-control-plane   istio-ingressgateway-6bb8fb6549-k4ln6   *             10m (0%)       2000m (25%)   11m (0%)   40Mi (0%)         1024Mi (8%)     50Mi (0%)
myk8s-control-plane   istio-ingressgateway-6bb8fb6549-k4ln6   istio-proxy   10m (0%)       2000m (25%)   11m (0%)   40Mi (0%)         1024Mi (8%)     50Mi (0%)
myk8s-control-plane   istiod-8d74787f-cqhs2                   *             10m (0%)       0m (0%)       8m (0%)    100Mi (0%)        0Mi (0%)        66Mi (0%)
myk8s-control-plane   istiod-8d74787f-cqhs2                   discovery     10m (0%)       0m (0%)       8m (0%)    100Mi (0%)        0Mi (0%)        66Mi (0%)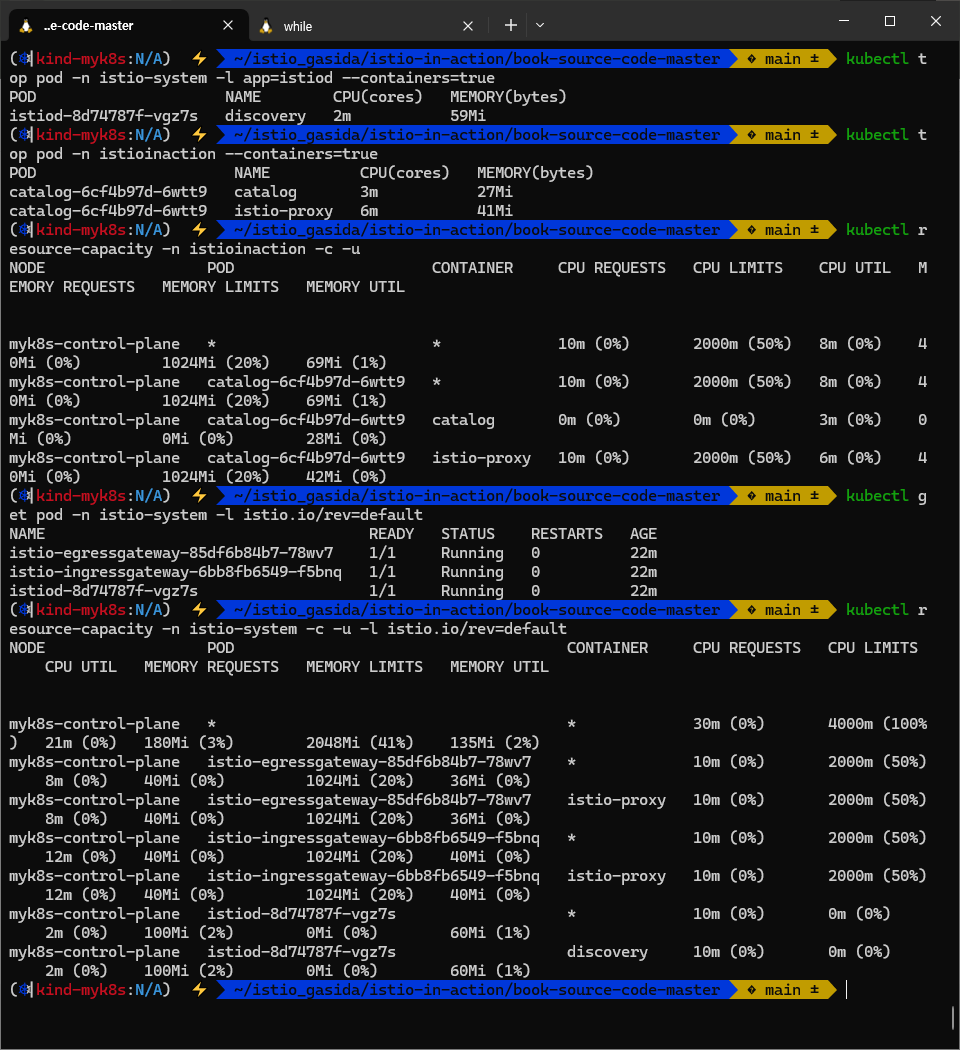
그림 11.6은 CPU 사용률 메트릭을 시각화하는 그래프를 보여준다.
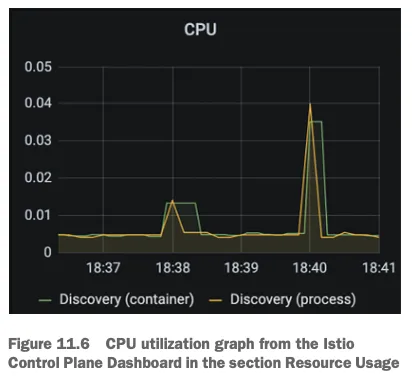
- 이 그래프는 istiod 에서 가장 일반적인 사용 패턴을 나타내는데, 대부분의 시간이 유휴 idle 시간이다.
- 서비스가 배포될 때 컴퓨팅 요청이 급증하는데, istiod가 엔보이 설정을 생성해 모든 워크로드로 푸시하기 때문이다.
- 컨트롤 플레인이 포하되면 리소스가 부족한 것이므로, 할당량을 다시 생각해야 한다.
- 컨트롤 플레인 동작을 최적화하기 위해 다른 접근법을 시도했었다면, 리소스를 늘리는 것이 최선의 선택일 것이다.
트래픽: 컨트롤 플레인의 부하는 어느 정도인가? TRAFFIC: WHAT IS THE LOAD ON THE CONTROL PLANE?
- 트래픽은 시스템이 겪는 부하를 측정한다. The traffic metrics measure the load the system experiences.
- 예를 들어, 웹 애플리케이션에서 부하는 초당 요청 수 (rps) 로 정의한다. for a web application, the load is defined by requests per second
- 한편, 이스티오의 컨트롤 플레인에는 수신 트래픽(설정 변경 형태)과 송신 트래픽(데이터 플레인으로 변경 푸시)이 있다. receiving incoming traffic (in the form of configuration changes) outgoing traffic (pushing changes to the data plane)
- 성능을 제한하는 요인을 찾으려면 양방향 트래픽을 모두 측정해야 한다.
- 그리고 그 측정치에 기반해 성능을 개선하는 데 여러 접근 방식을 취할 수 있다.
- 수신 트래픽에 대한 메트릭은 다음과 같다.
- pilot_inbound_updates
- 각 istiod 인스턴스가 설정 변경 수신 횟수를 보여준다. shows the count of configuration updates received per istiod instance
- 해당 메트릭을 사용하는 대시보드와 패널은 어디?
- pilot_push_triggers
- 푸시를 유발한 전체 이벤트 횟수다. the total count of events that triggered a push
- 푸시 원인은 서비스, 엔드포인트, 설정 중 한다. 여기서 설정이란 Gateway나 VirtualService 같은 이스티오 커스텀 리소스를 말한다. service, endpoint, or config, where config represents any Istio custom resource such as Gateway or VirtualService.
- 해당 메트릭을 사용하는 대시보드와 패널은 어디?
- pilot_services
- 파일럿이 인지하고 있는 서비스 개수를 측정한다. measures the number of services known to the pilot.
- 파일럿이 인지하는 서비스 개수가 늘어날수록, 이벤트를 수신할 때 엔보이 설정을 만들어내는 데 필요한 처리가 더 많아진다.
- 따라서, 이 수치는 istiod가 수신 트래픽 때문에 받는 부하량이 결정되는데 중요한 역할을 한다.
- pilot_inbound_updates
avg(pilot_virt_services{app="istiod"})   # istio vs 개수: kubectl get vs -A --no-headers=true | wc -l
avg(pilot_services{app="istiod"})        # k8s service 개수: kubectl get svc -A --no-headers=true | wc -l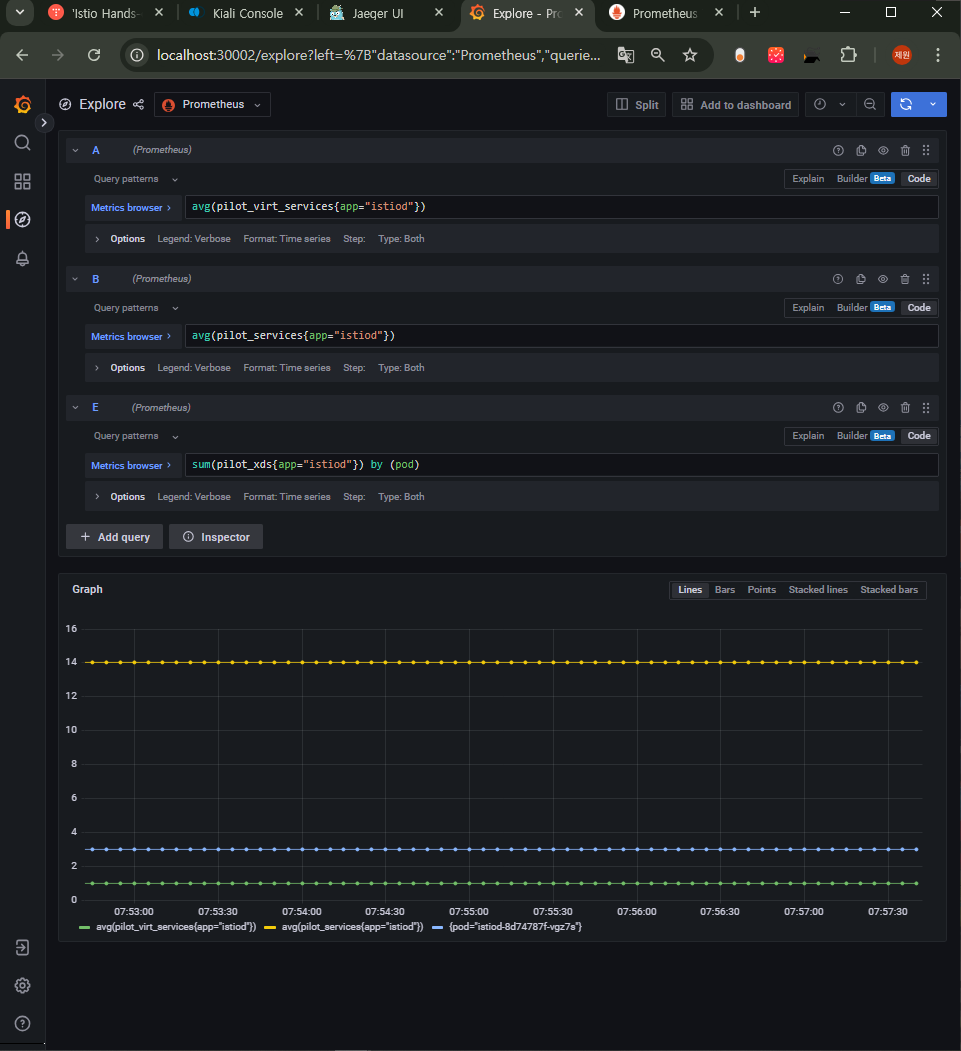
- 발신 트래픽에 대한 메트릭은 다음과 같다.
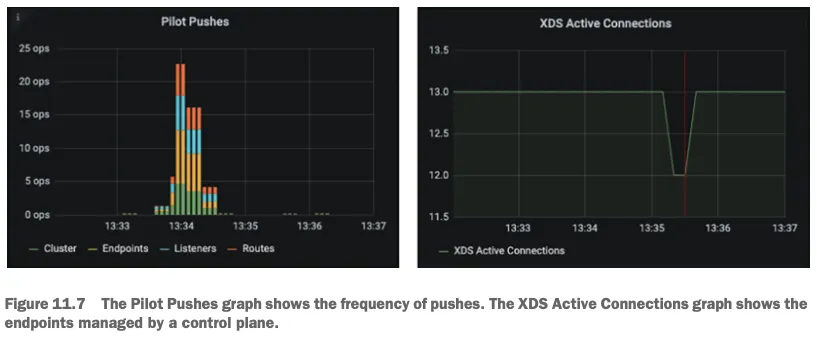
- pilot_xds_pushes
- 리스너, 루트, 클러스터, 엔드포인트 업데이트와 같이 컨트롤 플레인이 수행하는 모든 유형의 푸시를 측정한다.
- 이 메트릭은 Istio Control Plane 대시보드에서 Pilot Pushes 라는 이름의 그래프(패널)로 표시된다. (그림 11.7 참조)
- pilot_xds_pushes
sum(irate(pilot_xds_pushes{type="cds"}[1m]))
sum(irate(pilot_xds_pushes{type="eds"}[1m]))
sum(irate(pilot_xds_pushes{type="lds"}[1m]))
sum(irate(pilot_xds_pushes{type="rds"}[1m]))
- pilot_xds
- 워크로드로의 전체 커넥션 개수를 파일럿 인스턴스별로 보여준다. total connections to workloads handled per pilot instance.
- 이 메트릭은 Istio Control Plane 대시보드에서 ADS Monitoring 라는 이름의 그래프(패널)로 표시된다.
avg(pilot_virt_services{app="istiod"})   # istio vs 개수: kubectl get vs -A --no-headers=true | wc -l
avg(pilot_services{app="istiod"})        # k8s service 개수: kubectl get svc -A --no-headers=true | wc -l

# docker exec -it myk8s-control-plane istioctl proxy-status
pilot_xds
pilot_xds{app="istiod"}
sum(pilot_xds{app="istiod"})
sum(pilot_xds{app="istiod"}) by (pod)
- envoy_cluster_upstream_cx_tx_bytes_total
- 네트워크로 전송된 설정 크기를 측정한다. the configuration size that is transferred over the network.
- 대시보드에 XDS Requests Size 패널에 Legend: XDS Request Bytes Average
# rx
max(rate(envoy_cluster_upstream_cx_rx_bytes_total{cluster_name="xds-grpc"}[1m]))
quantile(0.5, rate(envoy_cluster_upstream_cx_rx_bytes_total{cluster_name="xds-grpc"}[1m]))

# tx
max(rate(envoy_cluster_upstream_cx_tx_bytes_total{cluster_name="xds-grpc"}[1m]))
quantile(.5, rate(envoy_cluster_upstream_cx_tx_bytes_total{cluster_name="xds-grpc"}[1m]))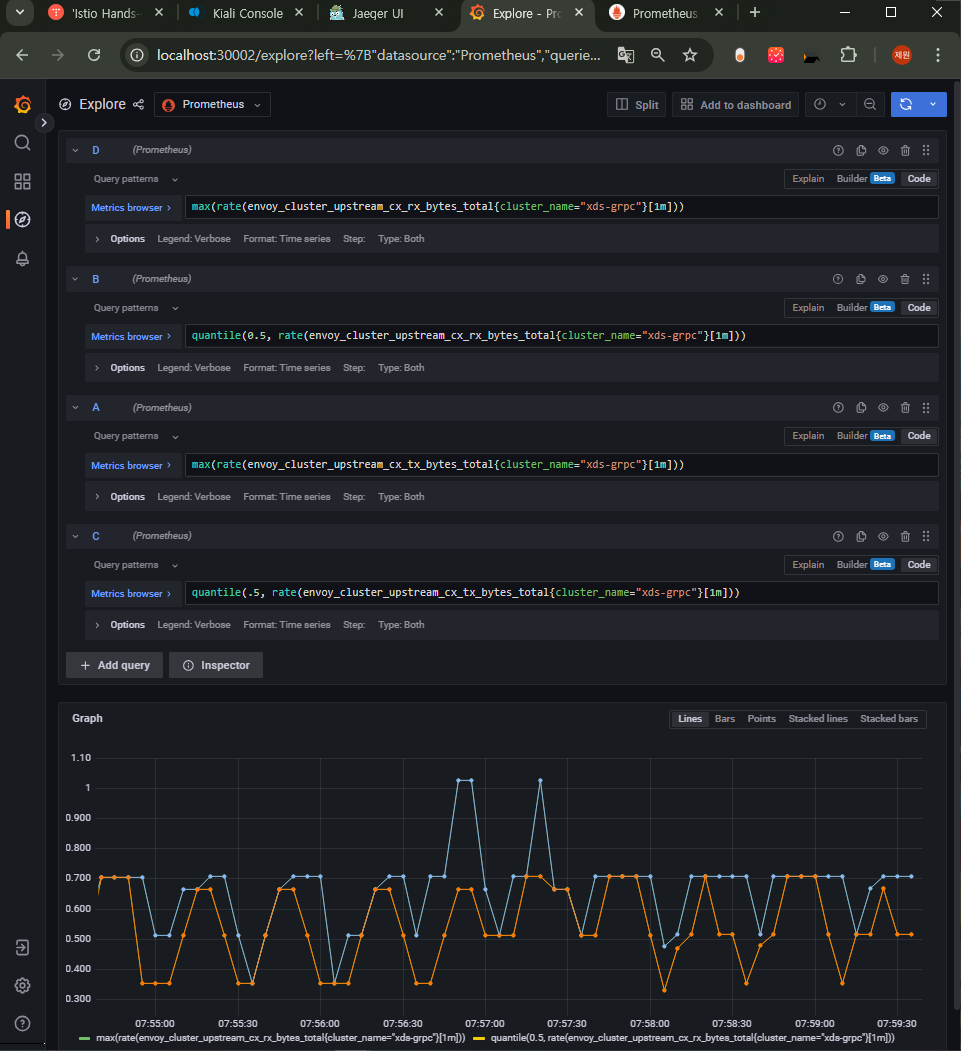
- 수신 트래픽과 송신 트래픽을 구분하면 포화의 원인과 사용할 수 있는 완화책이 명확해진다.
- 포화가 수신 트래픽 때문에 생기는 것이면 성능 병목은 변화율 때문이며, 해결책은 이벤트 배치 처리를 늘리거나 스케일 업하는 것이다.
- 만약 포화가 송신 트래픽과 관련 있으면, 해결책은 각 파일럿이 관리하는 인스턴스가 줄어들 수 있도록 컨트롤 플레인을 스케일 아웃하거나 모든 워크로드에 대해 사이드카 리소스를 정의하는 것이다.
오류: 컨트롤 플레인의 실패율은 어떻게 되는가? ERRORS: WHAT IS THE FAILURE RATE IN THE CONTROL PLANE?
- 오류는 isiotd의 실패율을 나타내며, 보통은 서비스가 포화 상태에 이르러 성능이 저하됐을 때 발생한다.
- 가장 중요한 오류 메트릭들은 표 11.1에 나열했는데, 이들은 Pilot Errors 라는 이름으로 Istio Control Plane 대시보드에 시각화돼 있다.
# 각 쿼리 패턴에 Legend 확인
Legend(Rejected CDS Configs) : sum(pilot_xds_cds_reject{app="istiod"}) or (absent(pilot_xds_cds_reject{app="istiod"}) - 1)
Legend(Rejected EDS Configs) : sum(pilot_xds_eds_reject{app="istiod"}) or (absent(pilot_xds_eds_reject{app="istiod"}) - 1)
Legend(Rejected RDS Configs) : sum(pilot_xds_rds_reject{app="istiod"}) or (absent(pilot_xds_rds_reject{app="istiod"}) - 1)
Legend(Rejected LDS Configs) : sum(pilot_xds_lds_reject{app="istiod"}) or (absent(pilot_xds_lds_reject{app="istiod"}) - 1)
Legend(Write Timeouts) : sum(rate(pilot_xds_write_timeout{app="istiod"}[1m]))
Legend(Internal Errors) : sum(rate(pilot_total_xds_internal_errors{app="istiod"}[1m]))
Legend(Config Rejection Rate) : sum(rate(pilot_total_xds_rejects{app="istiod"}[1m]))
Legend(Push Context Errors) : sum(rate(pilot_xds_push_context_errors{app="istiod"}[1m]))
Legend(Push Timeouts) : sum(rate(pilot_xds_write_timeout{app="istiod"}[1m]))
| 메트릭 | 설명 |
| pilot_total_xds_rejects | 설정 푸시 거부 횟수 |
| pilot_xds_’cds/lds/rds/cds’_reject | pilot_total_xds_rejects 메트릭의 부분집합. 어느 API 푸시가 거부됐는지 수사망을 좁히는 데 유용함 |
| pilot_xds_write_timeout | push를 시작할 때 발생한 오류와 타임아웃의 합계 |
| pilot_xds_push_context_errors | 엔보이 설정을 생성하는 동안 발생한 이스티오 파일럿 오류 횟수. 주로 이스티오 파일럿의 버그와 관련 |
- 표에서 가장 중요한 메트릭들이 포함돼 있다.
- 이 메트릭들은 컨트롤 플레인 상태는 어떤지, 컨트롤 플레인이 어떻게 동작하는지를 알려줘 성능 병목을 밝히는 데 도움이 된다.
11.3 성능 튜닝하기
들어가며 : 컨트롤 플레인 성능의 변수
- 컨트롤 플레인의 성능 요인은 클러스터/환경의 변화 속도, 리소스 할당량, 관리하는 워크로드 개수, 그 워크로드로 푸시하는 설정 크기 라는 점을 돌이켜보자. Recall that the control-plane performance factors are the rate of changes in the cluster/environment, the resources allocated to it, the number of workloads it manages, and the configuration size pushed to those workloads.
- 이들 중 하나라도 병목이 되면, 성능을 개선할 수 있는 방법은 그림 11.8처럼 여러 가지가 있다.

- 컨트롤 플레인 성능의 변수 The knobs of control-plane performance:
- 서비스 메시와 관련 없는 이벤트 무시하기. Ignoring events that are not relevant to the service mesh.
- 이벤트 배치 처리 기간을 좀 더 늘려 데이터 플레인 업데이트에 필요한 푸시 횟수 줄이기 Batching events for a longer period to reduce the number of pushes required to update the data plane.
- 다음 방법으로 리소스 추가 할당 Allocating additional resources by
- istiod 디플로이먼트 스케일 아웃하기 : 관리하는 워크로드를 파일럿 인스턴스들에 나눠 부하를 경감
- istiod 디플로이먼트 스케일 업하기 : 엔보이 설정 생성 속도를 높이고 더 많은 푸시 요청을 동시에 처리
- 워크로드가 관련 있는 설정을 컨트롤 플레인에게 알리는 사이드카 설정을 정의해 관련 있는 업데이트만 워크로드로 푸시하기. 2가지 이점. Pushing only relevant updates to workloads by defining a sidecar configuration that informs the control plane about the relevant configuration for a workload.
- 해당 프로세스에 필요한 최소한의 요청만을 보냄으로써 서비스 프록시에 보내는 설정 크기를 줄인다.
- 이벤트 하나로 업데이트되는 프록시 개수를 줄인다.
- 이런 방법으로 어떻게 성능을 개선하는지 보여줄 수 있도록 클러스터에 서비스를 준비하고 성능 테스트를 정의해보자.
11.3.1 워크스페이스 준비하기 : 실습 환경 준비 - 더미 워크로드와 서비스 생성
istiod에게 관리할 워크로드를 주기 위해 catalog 워크로드와 더미 워크로드 10개를 만들어보자
# 실습 환경 준비 : 11.2.1 에서 이미 설정함
kubectl -n istioinaction apply -f services/catalog/kubernetes/catalog.yaml
kubectl -n istioinaction apply -f ch11/catalog-virtualservice.yaml
kubectl -n istioinaction apply -f ch11/catalog-gateway.yaml
kubectl get deploy,gw,vs -n istioinaction
# 반복 설정 해두기
while true; do curl -s http://catalog.istioinaction.io:30000/items ; date "+%Y-%m-%d %H:%M:%S" ; sleep 1; echo; done
# 모니터링
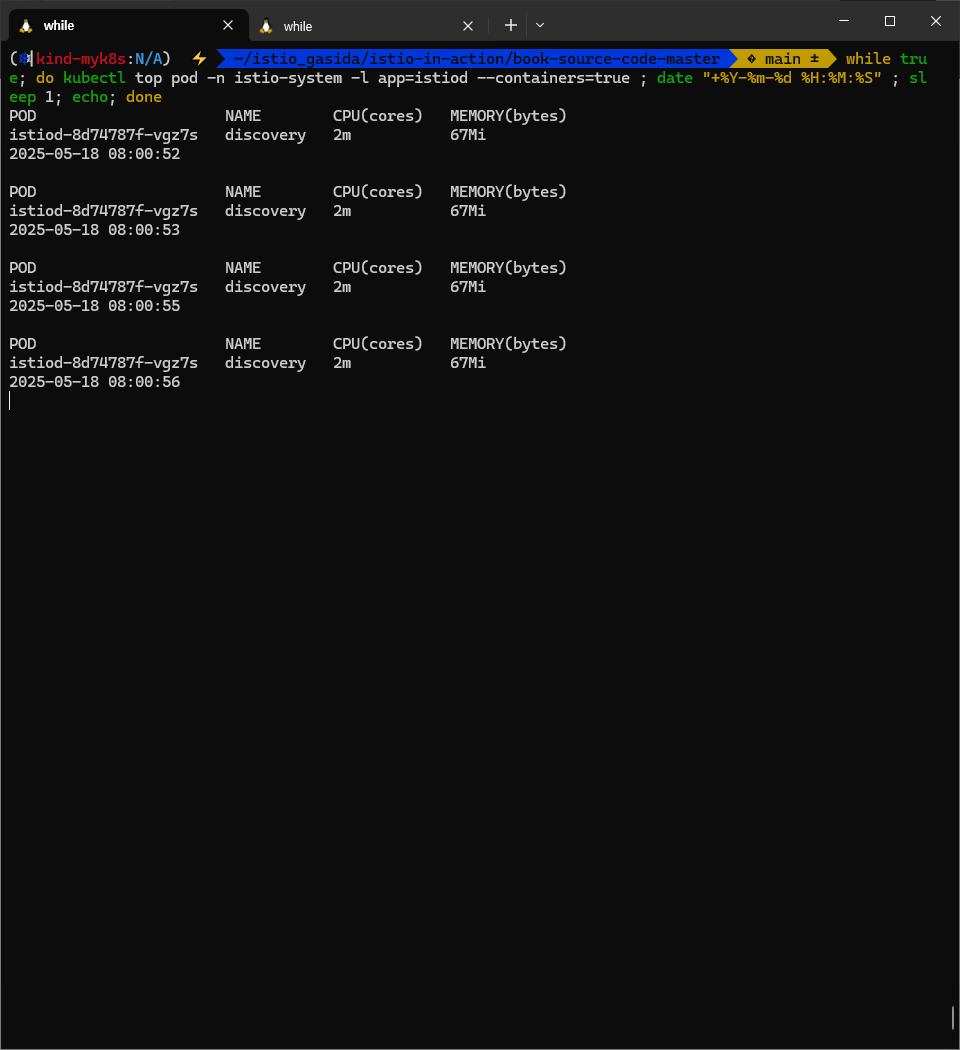
while true; do kubectl top pod -n istio-system -l app=istiod --containers=true ; date "+%Y-%m-%d %H:%M:%S" ; sleep 1; echo; done
POD NAME CPU(cores) MEMORY(bytes)
istiod-8d74787f-cqhs2 discovery 7m 65Mi
2025-05-11 15:04:34
POD NAME CPU(cores) MEMORY(bytes)
istiod-8d74787f-cqhs2 discovery 27m 82Mi
2025-05-11 15:04:36
...
# 더미 워크로드 10개 생성
cat ch11/sleep-dummy-workloads.yaml
...
apiVersion: v1
kind: Service
...
spec:
ports:
- port: 80
name: http
selector:
app: sleep
---
apiVersion: apps/v1
kind: Deployment
...
spec:
serviceAccountName: sleep
containers:
- name: sleep
image: governmentpaas/curl-ssl
command: ["/bin/sleep", "3650d"]
imagePullPolicy: IfNotPresent
...
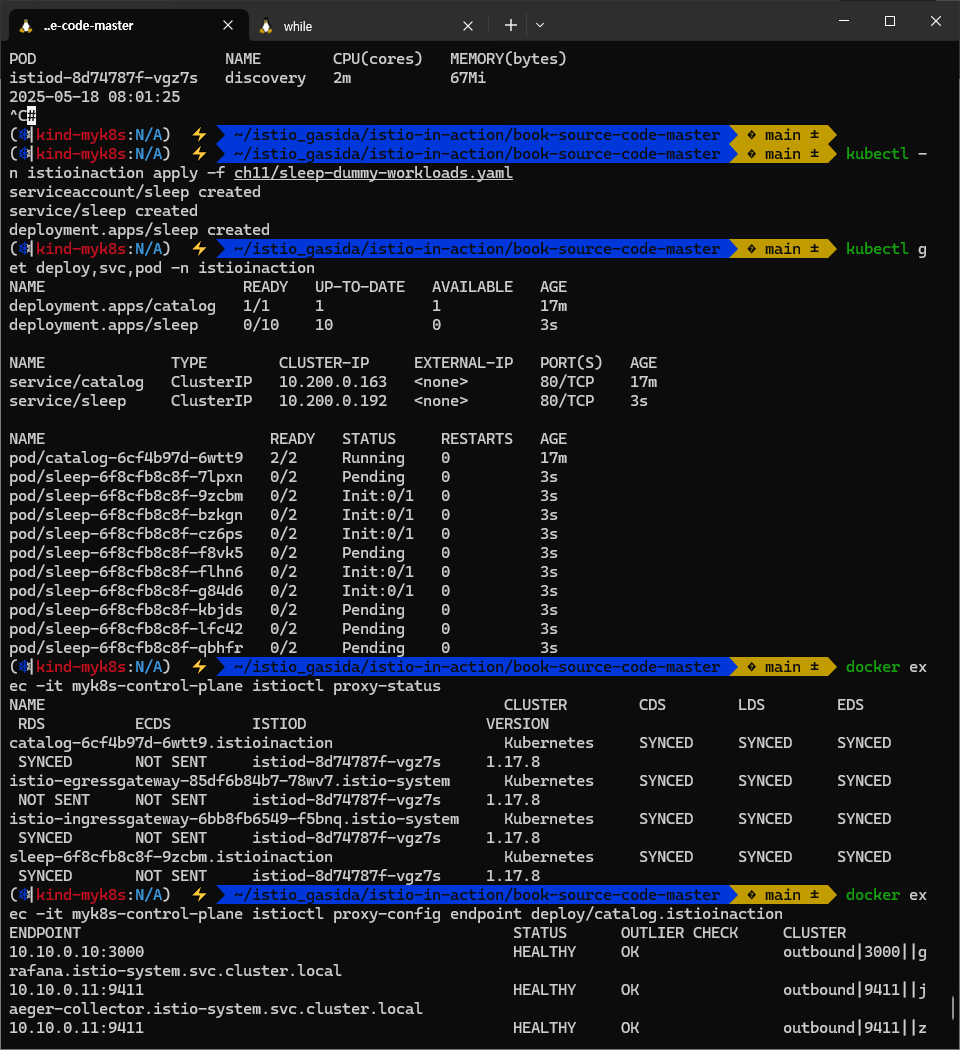
kubectl -n istioinaction apply -f ch11/sleep-dummy-workloads.yaml
# 확인
kubectl get deploy,svc,pod -n istioinaction
...
docker exec -it myk8s-control-plane istioctl proxy-status
NAME CLUSTER CDS LDS EDS RDS ECDS ISTIOD VERSION
catalog-6cf4b97d-5jtzt.istioinaction Kubernetes SYNCED SYNCED SYNCED SYNCED NOT SENT istiod-8d74787f-cqhs2 1.17.8
istio-egressgateway-85df6b84b7-m4699.istio-system Kubernetes SYNCED SYNCED SYNCED NOT SENT NOT SENT istiod-8d74787f-cqhs2 1.17.8
istio-ingressgateway-6bb8fb6549-k4ln6.istio-system Kubernetes SYNCED SYNCED SYNCED SYNCED NOT SENT istiod-8d74787f-cqhs2 1.17.8
sleep-6f8cfb8c8f-2nfrm.istioinaction Kubernetes SYNCED SYNCED SYNCED SYNCED NOT SENT istiod-8d74787f-cqhs2 1.17.8
...
#
docker exec -it myk8s-control-plane istioctl proxy-config cluster deploy/catalog.istioinaction --fqdn sleep.istioinaction.svc.cluster.local
docker exec -it myk8s-control-plane istioctl proxy-config endpoint deploy/catalog.istioinaction
10.10.0.16:80 HEALTHY OK outbound|80||sleep.istioinaction.svc.cluster.local
10.10.0.17:80 HEALTHY OK outbound|80||sleep.istioinaction.svc.cluster.local
10.10.0.18:80 HEALTHY OK outbound|80||sleep.istioinaction.svc.cluster.local
10.10.0.19:80 HEALTHY OK outbound|80||sleep.istioinaction.svc.cluster.local
...


그라파나 대시보드 : Last 5 minutes
이 정도는 파일럿에게 아직도 너무 쉽다. 몇 가지 더미 서비스로 엔보이 설정을 부풀려 상황을 악화시켜보자 : svc 200개, vs 200개, gw 200개
#
cat ch11/resources-600.yaml
cat ch11/resources-600.yaml | wc -l
9200
# 각각 200개
cat ch11/resources-600.yaml | grep 'kind: Service' | wc -l
cat ch11/resources-600.yaml | grep 'kind: Gateway' | wc -l
cat ch11/resources-600.yaml | grep 'kind: VirtualService' | wc -l
200
# 배포 : svc 200개, vs 200개, gw 200개
kubectl -n istioinaction apply -f ch11/resources-600.yaml
# 확인
kubectl get deploy,svc,pod -n istioinaction
...
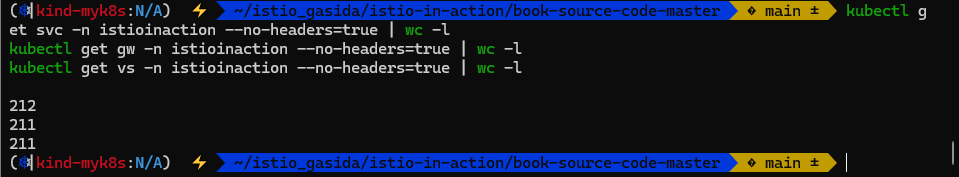
# k8s service 개수 202개
kubectl get svc -n istioinaction --no-headers=true | wc -l
202
kubectl get gw,vs -n istioinaction
...
#
docker exec -it myk8s-control-plane istioctl proxy-status
docker exec -it myk8s-control-plane istioctl proxy-config listener deploy/catalog.istioinaction
docker exec -it myk8s-control-plane istioctl proxy-config route deploy/catalog.istioinaction
docker exec -it myk8s-control-plane istioctl proxy-config cluster deploy/catalog.istioinaction
docker exec -it myk8s-control-plane istioctl proxy-config endpoint deploy/catalog.istioinaction
그라파나 대시보드 : Last 15 minutes
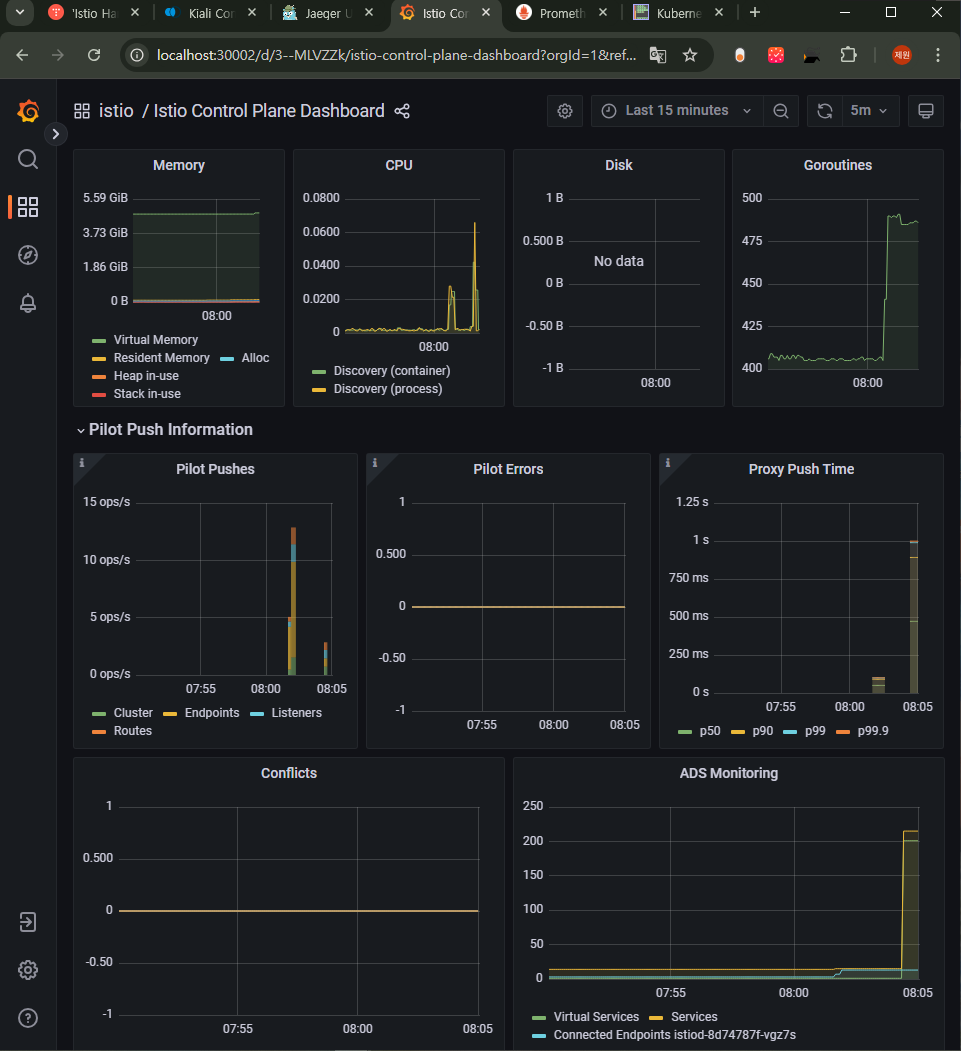
- 그래서 이제 istiod 인스턴스 하나가 인그레스 및 이그레스 게이트웨이를 포함해 워크로드(istio-proxy 동작)를 13개 관리하며, 서비스는 총 600개(svc + vs + gw) 인지하고 있다.
- 서비스 개수는 엔보이 설정을 만드는 데 필요한 처리량을 늘리고, 워크로드로 보내야 하는 설정을 부풀린다. So now the single istiod instance manages 13 workloads, including ingress and egress gateways, and another 600 total services are known to it, which increases the amount of processing to generate the Envoy configuration and bloats the configuration that has to be pushed to the workloads.
11.3.2 최적화 전 성능 측정하기* Measuring performance before optimizations Sidecar
들어가며 : 테스트 실행
- 이제 테스트로 컨트롤 플레인 성능을 판단할 것이다.
- 테스트는 서비스를 반복적으로 만들어 부하를 생성하고, 프록시에 설정을 업데이트하는 데 걸리는 지연 시간과 P99 값과 푸시 개수를 측정한다. We’ll determine the control-plane performance with a test that generates load by creating services repeatedly and then measures both the number of pushes and the 99th percentile (P99) latency to distribute the configuration updates to the proxies.
P99 이해하기
P99(또는 percentile 백분위 99)는 업데이트 전파 중 가장 빠른 99%의 최대 지연 시간을 측정한다. 예를 들어 ‘P99 지연 시간이 80ms이다’는 요청 중 99%가 80ms 보다 빠르게 전파됐음을 말한다! 각 요청이 정확히 어떻게 분포하는지는 알지 못하며, 대부분은 수 ms 범위일 수 있다. 그러나 가장 빠른 99%만을 고려할 때 가장 느린 요청도 80ms안에 처리됐음을 알 수 있다. But we know that even the worst-performing request was served within 80 ms when considering only the fastest 99%.
(첫 번째) 테스트를 10회 반복하되, 반복 사이에 2.5초 간격을 두자. Let’s run the test with 10 repetitions and a delay of 2.5 seconds
이는 변경을 흩뿌려 배치 처리되는 상황을 피하려는 것이다. between repetitions to spread out the changes and avoid having them batched
bin/performance-test.sh : 파일 수정 해두기! $GATEWAY:30000/items
#!/bin/bash

main(){
  ## Pass input args for initialization
  init_args "$@"

  SLEEP_POD=$(kubectl -n istioinaction get pod -l app=sleep -o jsonpath={.items..metadata.name} -n istioinaction | cut -d ' ' -f 1)

  PRE_PUSHES=$(kubectl exec -n istio-system deploy/istiod -- curl -s localhost:15014/metrics | grep pilot_xds_pushes | awk '{total += $2} END {print total}')

  if [[ -z "$PRE_PUSHES" ]]; then
    echo "Failed to query Pilot Pushes from prometheus."
    echo "Have you installed prometheus as shown in chapter 7?"
    exit 1
  fi

  echo "Pre Pushes: $PRE_PUSHES"

  INDEX="0"
  while [[ $INDEX -lt $REPS ]]; do
    SERVICE_NAME="service-`openssl rand -hex 2`-$INDEX"

    create_random_resource $SERVICE_NAME &
    sleep $DELAY
    INDEX=$[$INDEX+1]
  done

  ## Wait until the last item is distributed
  while [[ "$(curl --max-time .5 -s -o /dev/null -H "Host: $SERVICE_NAME.istioinaction.io" -w ''%{http_code}'' $GATEWAY:30000/items)" != "200" ]]; do
    # curl --max-time .5 -s -o /dev/null -H "Host: $SERVICE_NAME.istioinaction.io" $GATEWAY/items
    sleep .2
  done

  echo ==============

  sleep 10

  POST_PUSHES=$(kubectl exec -n istio-system deploy/istiod -- curl -s localhost:15014/metrics | grep pilot_xds_pushes | awk '{total += $2} END {print total}')

  echo

  LATENCY=$(kubectl -n istioinaction exec -it $SLEEP_POD -c sleep -- curl "$PROM_URL/api/v1/query" --data-urlencode "query=histogram_quantile(0.99, sum(rate(pilot_proxy_convergence_time_bucket[1m])) by (le))" | jq  '.. |."value"? | select(. != null) | .[1]' -r)

  echo "Push count:" `expr $POST_PUSHES - $PRE_PUSHES`
  echo "Latency in the last minute: `printf "%.2f\n" $LATENCY` seconds"
}

create_random_resource() {
  SERVICE_NAME=$1
  cat <<EOF | kubectl apply -f -
---
kind: Gateway
apiVersion: networking.istio.io/v1alpha3
metadata:
  name: $SERVICE_NAME
  namespace: $NAMESPACE
spec:
  servers:
    - hosts:
        - "$SERVICE_NAME.istioinaction.io"
      port:
        name: http
        number: 80
        protocol: HTTP
  selector:
    istio: ingressgateway
---
apiVersion: v1
kind: Service
metadata:
  labels:
    app: catalog
  name: $SERVICE_NAME
  namespace: $NAMESPACE
spec:
  ports:
  - name: http
    port: 80
    protocol: TCP
    targetPort: 3000
  selector:
    app: catalog
---
apiVersion: networking.istio.io/v1alpha3
kind: VirtualService
metadata:
  name: $SERVICE_NAME
  namespace: $NAMESPACE
spec:
  hosts:
  - "$SERVICE_NAME.istioinaction.io"
  gateways:
  - "$SERVICE_NAME"
  http:
  - route:
    - destination:
        host: $SERVICE_NAME.istioinaction.svc.cluster.local
        port:
          number: 80
---
EOF
}

help() {
    cat <<EOF
Poor Man's Performance Test creates Services, Gateways and VirtualServices and measures Latency and Push Count needed to distribute the updates to the data plane.
       --reps         The number of services that will be created. E.g. --reps 20 creates services [0..19]. Default '20'
       --delay        The time to wait prior to proceeding with another repetition. Default '0'
       --gateway      URL of the ingress gateway. Defaults to 'localhost'
       --namespace    Namespace in which to create the resources. Default 'istioinaction'
       --prom-url     Prometheus URL to query metrics. Defaults to 'prom-kube-prometheus-stack-prometheus.prometheus:9090'
EOF
    exit 1
}

init_args() {
  while [[ $# -gt 0 ]]; do
      case ${1} in
          --reps)
              REPS="$2"
              shift
              ;;
          --delay)
              DELAY="$2"
              shift
              ;;
          --gateway)
              GATEWAY="$2"
              shift
              ;;
          --namespace)
              NAMESPACE="$2"
              shift
              ;;
          --prom-url)
              PROM_URL="$2"
              shift
              ;;
          *)
              help
              ;;
      esac
      shift
  done

  [ -z "${REPS}" ] &&  REPS="20"
  [ -z "${DELAY}" ] &&  DELAY=0
  [ -z "${GATEWAY}" ] &&  GATEWAY=localhost
  [ -z "${NAMESPACE}" ] &&  NAMESPACE=istioinaction
  [ -z "${PROM_URL}" ] &&  PROM_URL="prom-kube-prometheus-stack-prometheus.prometheus.svc.cluster.local:9090"
}

main "$@"
여러 개의 임의 서비스 리소스를 생성 → Istio의 xDS Push 횟수 증가량 측정, Prometheus에서 프록시 구성 수렴 시간(latency) 확인 ⇒ 최종적으로 Push 성능과 latency를 평가
# (참고) 호출
curl -H "Host: catalog.istioinaction.io" localhost:30000/items
# 확인
kubectl get svc -n istioinaction --no-headers=true | wc -l
kubectl get gw -n istioinaction --no-headers=true | wc -l
kubectl get vs -n istioinaction --no-headers=true | wc -l
# :30000 포트 정보 추가해둘것!
cat bin/performance-test.sh
...
Poor Man's Performance Test creates Services, Gateways and VirtualServices and measures Latency and Push Count needed to distribute the updates to the data plane.
--reps The number of services that will be created. E.g. --reps 20 creates services [0..19]. Default '20'
--delay The time to wait prior to proceeding with another repetition. Default '0'
--gateway URL of the ingress gateway. Defaults to 'localhost'
--namespace Namespace in which to create the resources. Default 'istioinaction'
--prom-url Prometheus URL to query metrics. Defaults to 'prom-kube-prometheus-stack-prometheus.prometheus:9090'
...
# 성능 테스트 스크립트 실행!
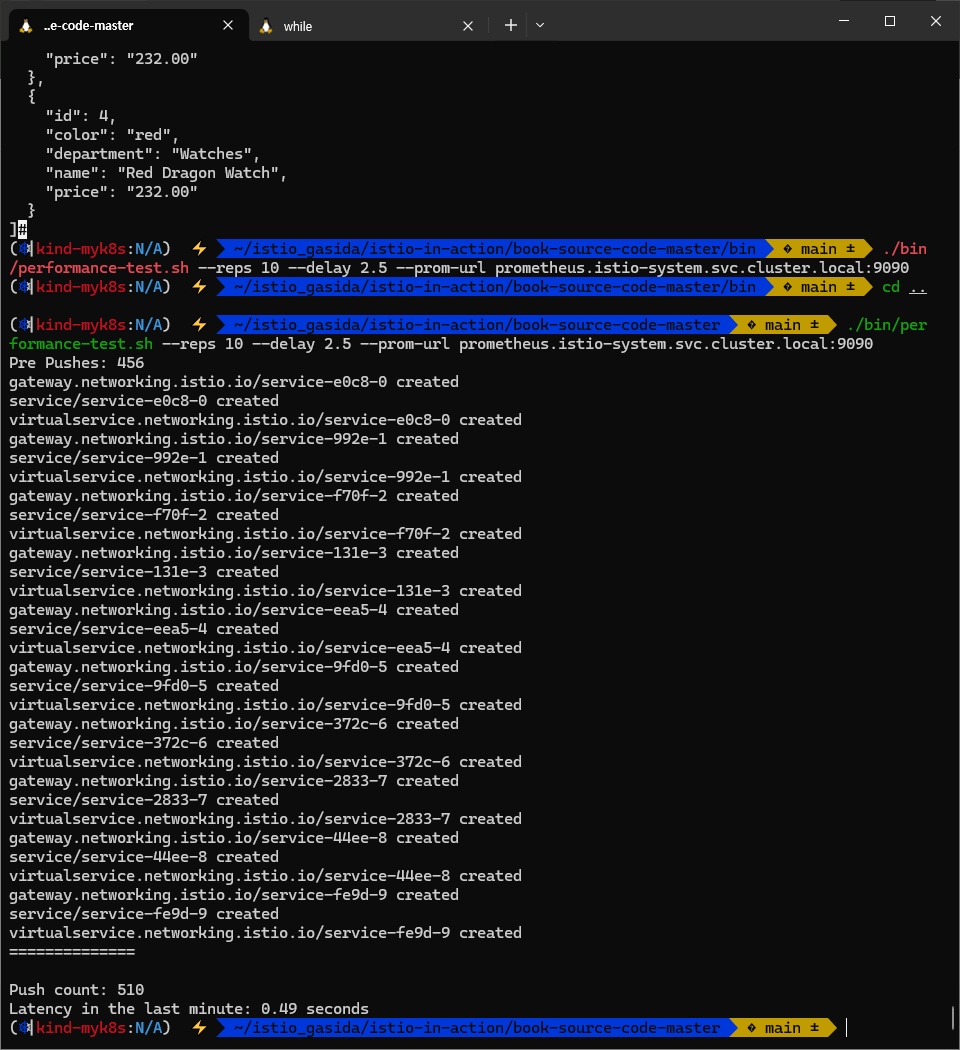
./bin/performance-test.sh --reps 10 --delay 2.5 --prom-url prometheus.istio-system.svc.cluster.local:9090
Pre Pushes: 335
...
ateway.networking.istio.io/service-00a9-9 created
service/service-00a9-9 created
virtualservice.networking.istio.io/service-00a9-9 created
==============
Push count: 510 # 변경 사항을 적용하기 위한 푸시 함수
Latency in the last minute: 0.45 seconds # 마지막 1분 동안의 지연 시간
# 확인
kubectl get svc -n istioinaction --no-headers=true | wc -l
kubectl get gw -n istioinaction --no-headers=true | wc -l
kubectl get vs -n istioinaction --no-headers=true | wc -l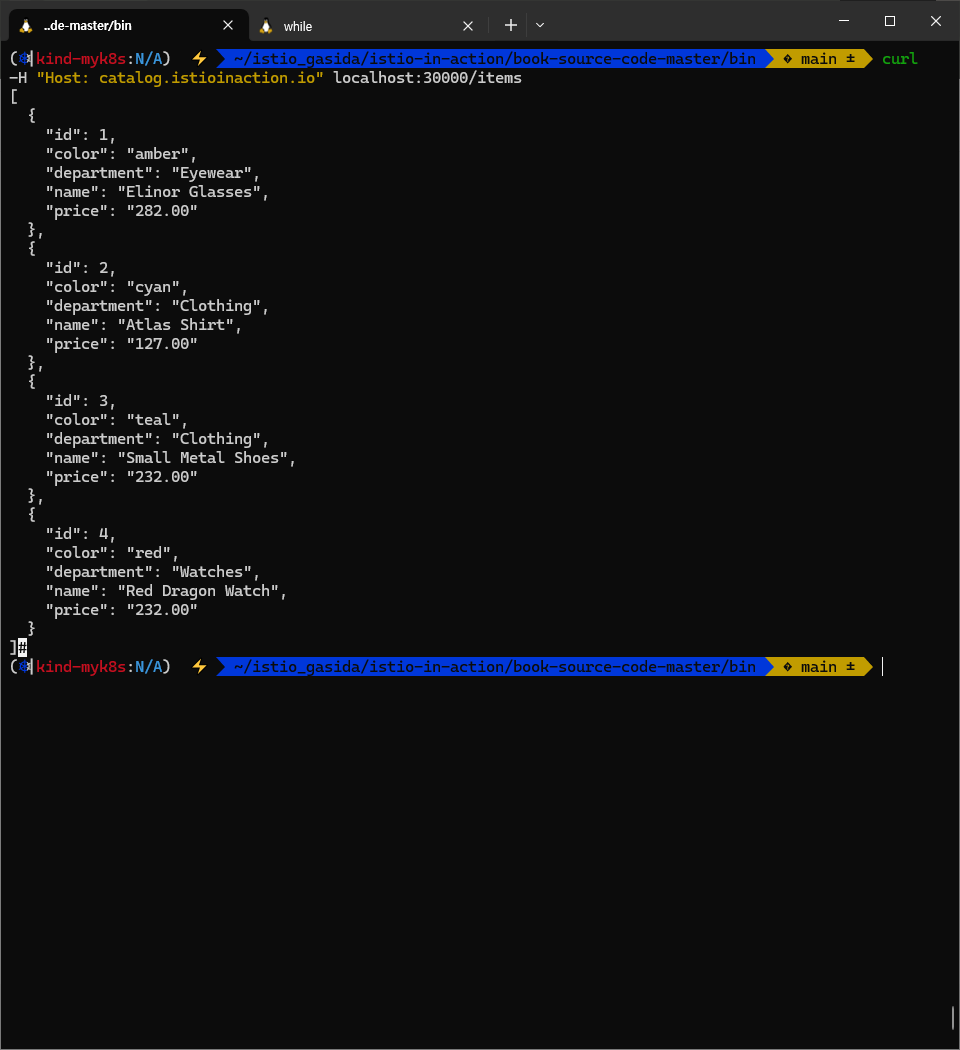
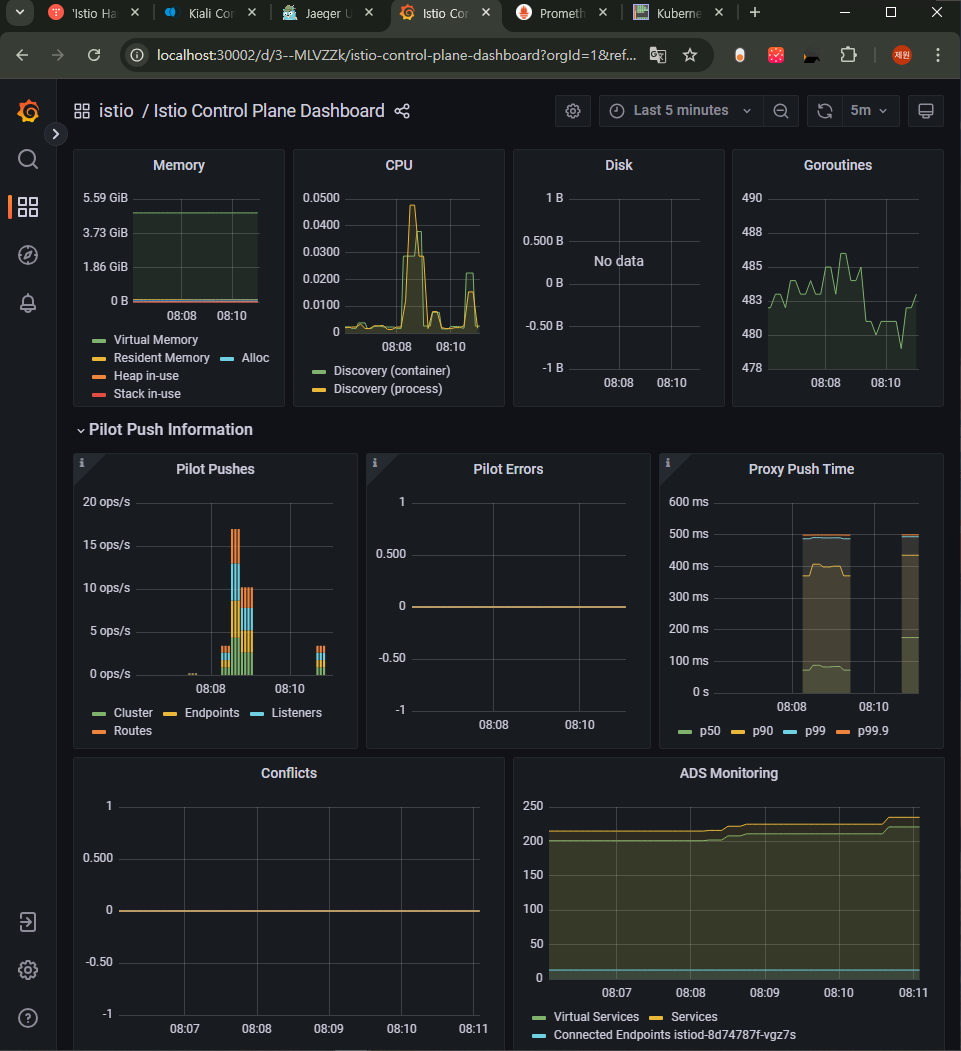
그라파나 : Last 5분
(두 번째) 딜레이 없이 실행
# 성능 테스트 스크립트 실행 : 딜레이 없이
./bin/performance-test.sh --reps 10 --prom-url prometheus.istio-system.svc.cluster.local:9090
Push count: 51
Latency in the last minute: 0.47 seconds

# 확인
kubectl get svc -n istioinaction --no-headers=true | wc -l
kubectl get gw -n istioinaction --no-headers=true | wc -l
kubectl get vs -n istioinaction --no-headers=true | wc -l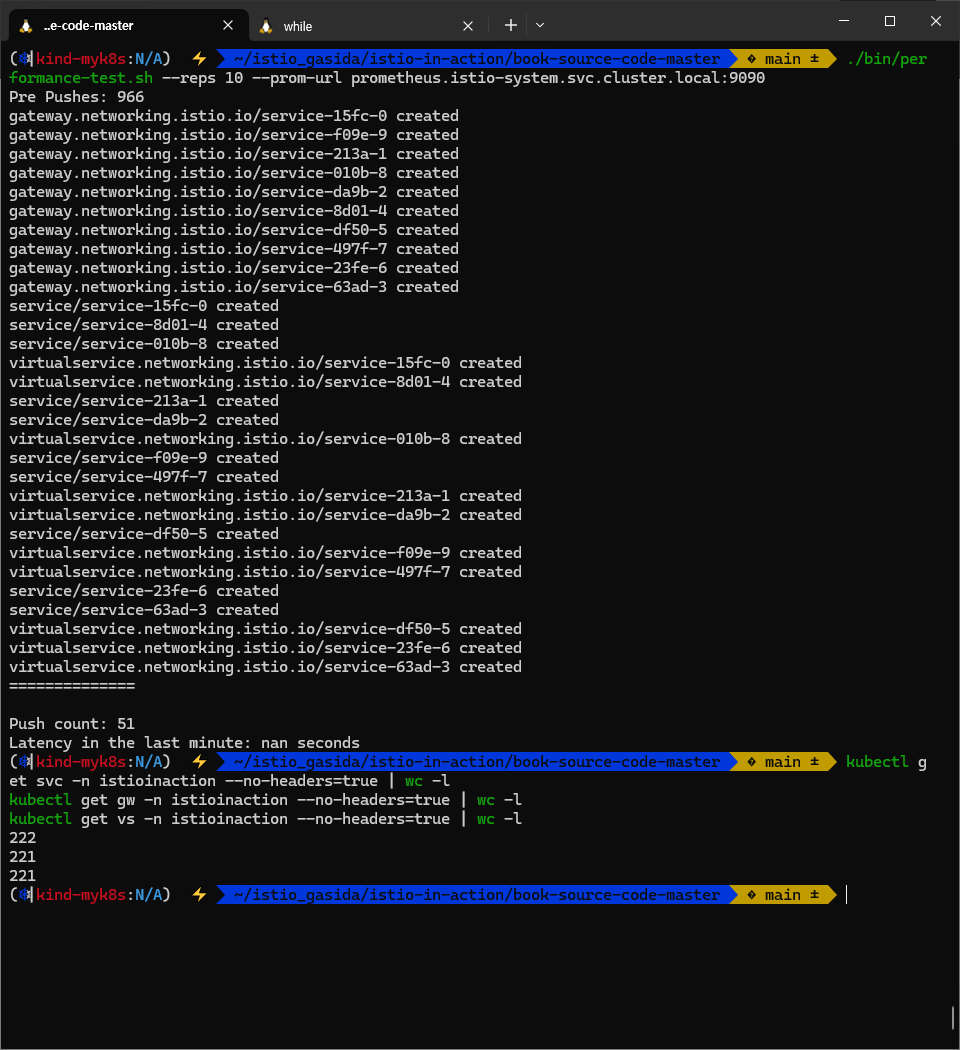
(세 번째) 딜레이 좀 더 늘려서 실행
# 성능 테스트 스크립트 실행 : 딜레이 없이
./bin/performance-test.sh --reps 10 --delay 5 --prom-url prometheus.istio-system.svc.cluster.local:9090
Push count: 510
Latency in the last minute: 0.43 seconds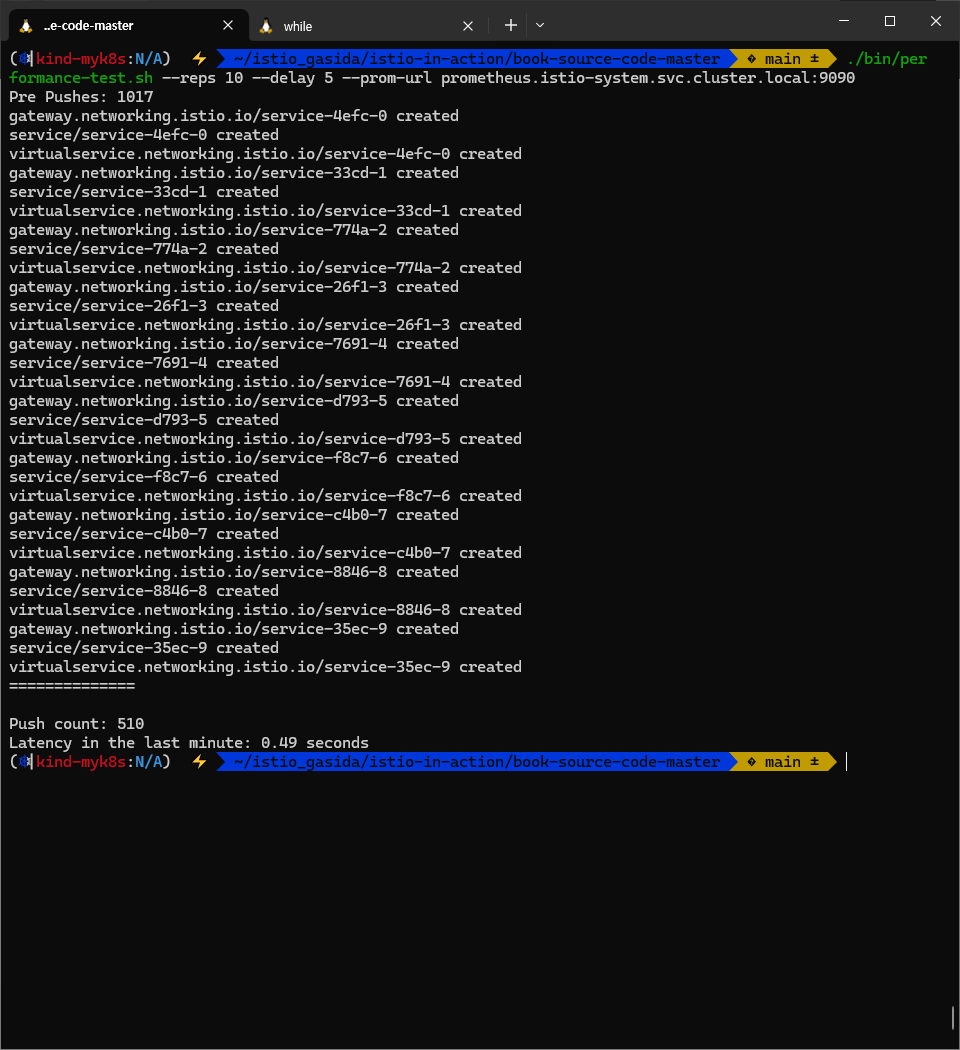
테스트 정리
- (첫 번째) 테스트에 따르면, 현재 설정으로는 510회의 푸시가 P99 지연 시간 0.45초로 수행됐다.
- ***Push count: 510 # 변경 사항을 적용하기 위한 푸시 함수 Latency in the last minute: 0.45 seconds # 마지막 1분 동안의 지연 시간, 책은 ms로 표기..***
- (두 번째) 테스트에 따르면, 서비스 간의 간격을 없애면, 푸시 횟수와 지연 시간 모두 떨어지는 것을 볼 수 있다. 이는 이벤트가 배치 처리돼서 더 적은 작업량으로 처리되기 때문이다.
- *Push count: **51** Latency in the last minute: **0.47 seconds***
- 당신의 측정값은 다를 수 있지만, 괜찮다.
- 이 테스트의 목표는 후속 절들에서 최적화를 실행한 후의 성능 향상을 검증할 수 있는 ‘충분히 좋은’ 측정을 하는 것이다.
사이드카를 사용해 푸시 횟수 및 설정 크기 줄이기 REDUCING CONFIGURATION SIZE AND NUMBER OF PUSHES USING SIDECARS
- 마이크로서비스 환경에서 한 서비스가 다른 서비스에 의존하는 것은 흔한 일이다.
- 그러나 한 서비스가 다른 모든 가용 서비스에 접근해야 하는 것도 드믄 일이다 (아니면 적어도 이런 상황을 피하려고는 한다)
- 기본적으로 이스티오는 각 서비스가 어떤 접근이 필요한지 알 수 없으므로, 기본값은 모든 서비스 프록시가 메시의 모든 워크로드를 알도록 한다!
- 이로 인해 프록시의 설정이 쓸데없이 부풀려진다는 점은 쉽게 알 수 있다.
- 예를 들어 catalog 워크로드의 설정 크리를 계산해보자.
#
CATALOG_POD=$(kubectl -n istioinaction get pod -l app=catalog -o jsonpath='{.items..metadata.name}' | cut -d ' ' -f 1)
kubectl -n istioinaction exec -ti $CATALOG_POD -c catalog -- curl -s localhost:15000/config_dump > /tmp/config_dump
du -sh /tmp/config_dump
1.8M /tmp/config_dump
#
docker exec -it myk8s-control-plane istioctl proxy-config listener deploy/catalog.istioinaction
docker exec -it myk8s-control-plane istioctl proxy-config route deploy/catalog.istioinaction
docker exec -it myk8s-control-plane istioctl proxy-config cluster deploy/catalog.istioinaction
#
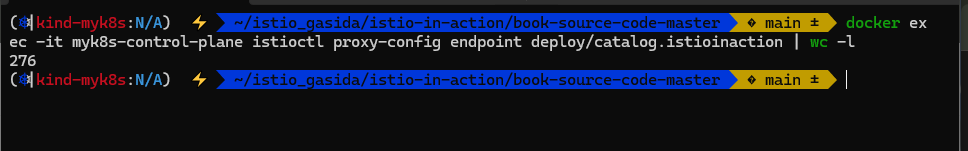
docker exec -it myk8s-control-plane istioctl proxy-config endpoint deploy/catalog.istioinaction
docker exec -it myk8s-control-plane istioctl proxy-config endpoint deploy/catalog.istioinaction | wc -l
275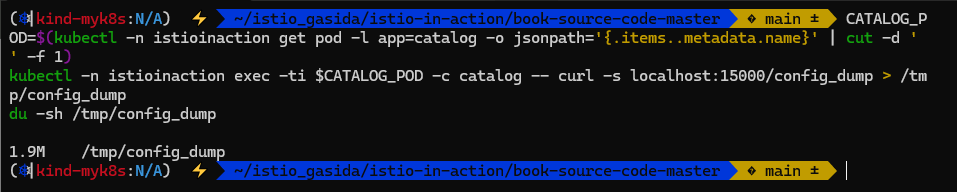
- 지금 설정 크키가 대략 2MB 인데, 이는 엄청 많은 것이다!
- 워크로드가 200개인 중간 클러스터만 돼도 엔보이 설정이 400MB로 늘어나며, 이로 인해 연산 성능, 네트워크 대역폭, 메모리가 더 많이 필요하다.
- 이 설정이 모든 사이드카 프록시에 저장되기 때문이다.
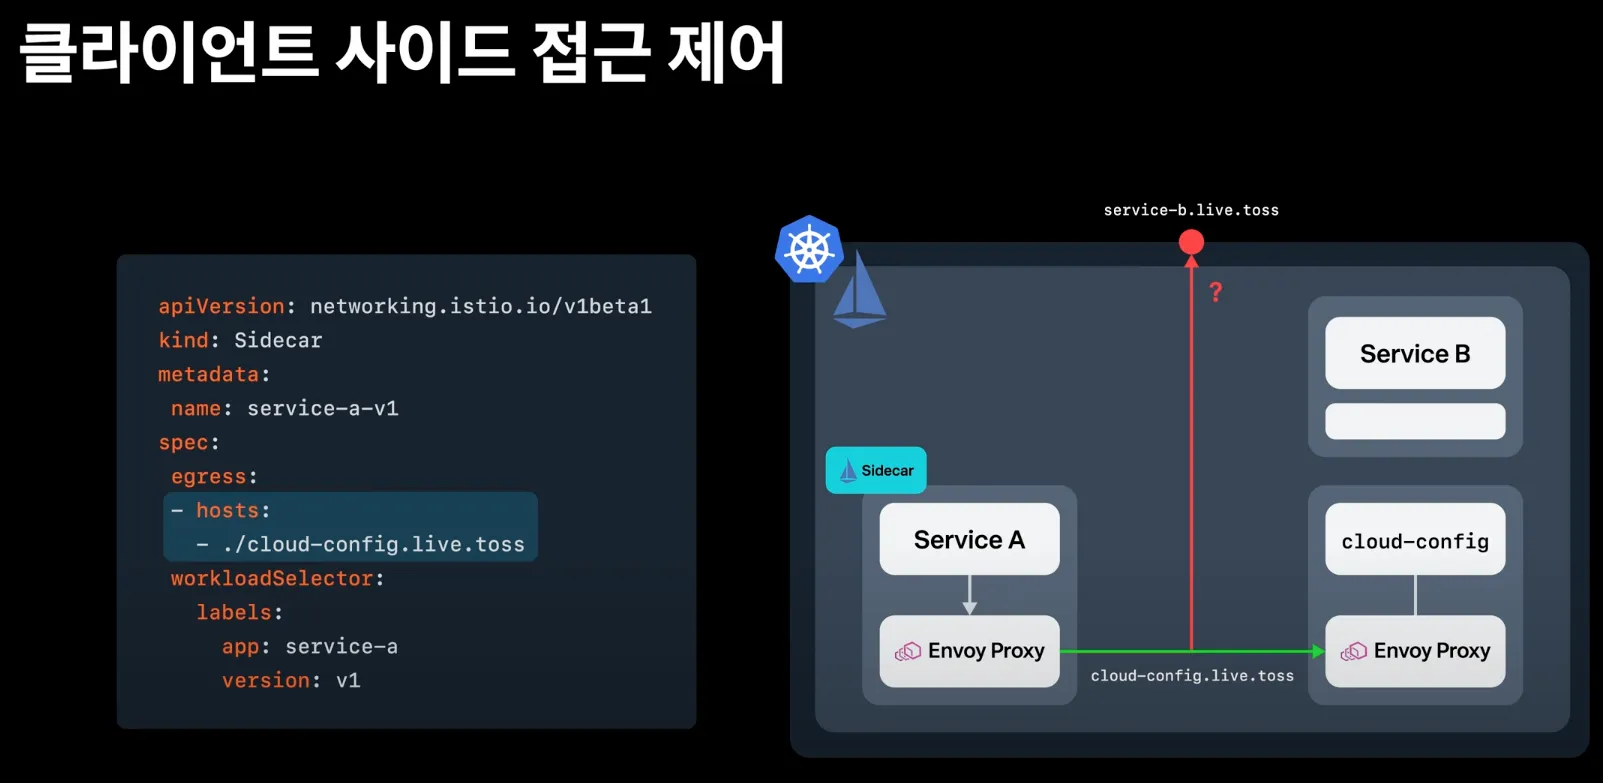
Sidecar 리소스
- 이런 문제를 해결하기 위해 Sidecar 리소스를 사용해 사이드카 프록시에 드나드는 트래픽의 설정을 세밀하게 조정할 수 있다.
- 이 작업을 수행하는 방법을 이해하기 위해 예시 리소스를 살펴보자.
apiVersion: networking.istio.io/v1beta1
kind: Sidecar
metadata:
  name: default
  namespace: istioinaction
spec:
  workloadSelector:
    labels:
      app: foo
  egress:
  -hosts:
   - "./bar.istioinaction.svc.cluster.local"
   - "istio-system/*"
  outboundTrafficPolicy:
mode: REGISTRY_ONLY- workloadSelector
- 사이드카 설정을 적용할 워크로드를 제한한다. limits the workloads to which the sidecar configuration applies.
- ingress
- 애플리케이션에 들어오는 트래픽 처리를 지정한다. specifies the handling of inbound traffic to the application.
- 생략하면, 이스티오는 파드 정의를 조회해 서비스 프록시를 자동으로 설정한다. If omitted, Istio configures the service proxy automatically by looking up the Pod definition.
- egress
- 사이드카를 거치는 외부 서비스로의 송신 트래픽 처리를 지정한다. specifies the handling of the application’s outbound traffic to an external service through the sidecar.
- 생략되면, 설정은 좀 더 일반적인 사이드카에서 egress 설정을 상속한다 (있는 경우).
- 없으면, 다른 모든 서비스에 접근할 수 있도록 설정하는 기본 동작으로 대처한다. If omitted, the configuration inherits the egress configuration from a more generic sidecar, if present; otherwise, it falls back on the default behavior of configuring access to all other services.
- outboundTrafficPolicy : 송신 트래픽 처리 시 모드 지정. specifies the mode for handling outbound traffic.
- REGISTRY_ONLY 모드 : 워크로드가 설정한 서비스에만 트래픽을 보낼 수 있게 한다.
- ALLOW_ANY 모드 : 어디로든 트래픽 송신을 허용한다.
- Sidecar 리소스를 워크로드에 적용하면, 컨트롤 플레인은 egress 필드를 사용해 워크로드가 어떤 서비스들에 접근해야 하는지 판단한다. When a Sidecar resource applies to a workload, the control plane uses the egress field to determine which services the workload requires access to.
- 덕분에 컨트롤 플레인은 관련 있는 설정과 업데이트를 파악하고 해당 프록시로만 보낼 수 있다.
- 그 결과, 다른 모든 서비스에 도달하는 방법에 대한 설정을 모두 생성하고 배포하는 일을 방지해 ‘CPU, 메모리, 네트워크 대역폭 소모’를 줄일 수 있다.
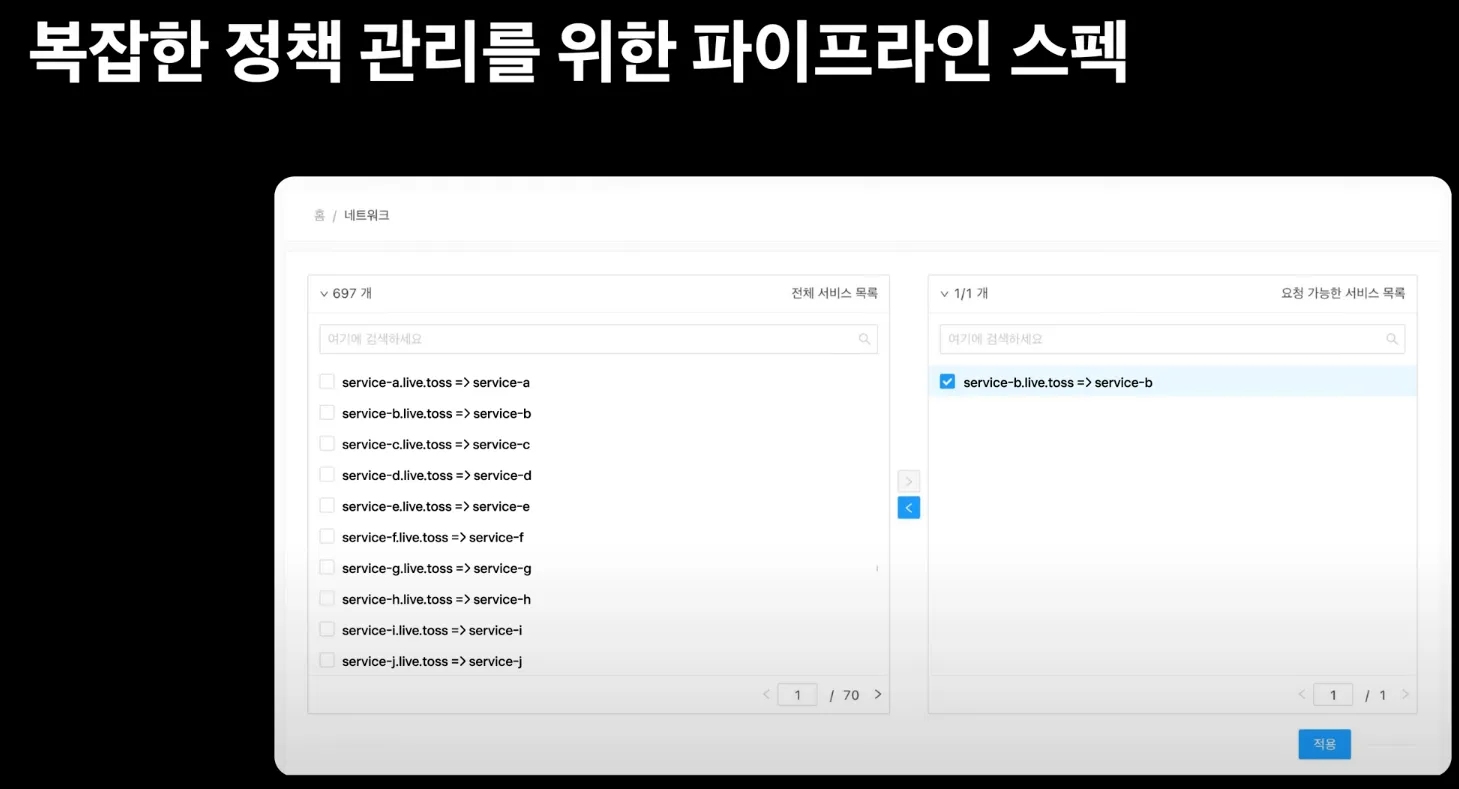
메시 범위 사이드카 설정으로 더 나은 기본값 정의하기 DEFINING BETTER DEFAULTS WITH A MESH-WIDE SIDECAR CONFIGURATION

- 모든 서비스 프록시로 전송되는 엔보이 설정을 줄여 컨트롤 플레인 성능을 개선할 수 있는 가장 쉬운 방법은 트래픽 송신을 istio-system 네임스페이스의 서비스로만 허용하는 사이드카 설정을 메시 범위로 정의하는 것이다.
- 기본값을 이렇게 정의하면, 최소 설정으로 메시 내 모든 프록시가 컨트롤 플레인에만 연결하도록 하고 다른 서비스로의 연결 설정은 모두 삭제할 수 있다.
- 이 방식은 서비스 소유자를 올바른 길로 유도하는데, 워크로드용 사이드카 정의를 좀 더 구체적으로 정의하고 서비스에 필요한 트래픽 송신을 모두 명시적으로 기술함게 함(강제 유도?)으로써 워크로드가 프로세스에 필요한 관련 설정을 최소한으로 수신할 수 있게 한다.
- 다음 사이드카 정의를 사용하면, 메시 내 모든 서비스 사이트가가 istio-system 네임스페이스에 있는 이스티오 서비스로만 연결하도록 설정할 수 있다. (메트릭을 수집할 수 있드록 프로메테우스 네임스페이스도 연결한다)
- 이제 컨트롤 플레인은 서비스 프록시가 istio-system / prometheus 네임스페이스의 서비스로 연결할 수 있는 최소한의 설정만 갖도록 업데이트 한다.
- 우리의 가설이 맞다면, catalog 워크로드의 엔보이 설정 크기는 현저히 줄어야 한다. 확인해보자.
# cat ch11/sidecar-mesh-wide.yaml
apiVersion: networking.istio.io/v1beta1
kind: Sidecar
metadata:
  name: default # istio-system 네임스페이스의 사이드카는 메시 전체에 적용된다.
  namespace: istio-system # 위 설명 동일.
spec:
  egress:
  - hosts:
    - "istio-system/*" # istio-system 네임스페이스의 워크로드만 트래픽 송신을 할 수 있게 설정한다.
    - "prometheus/*"   # 프로메테우스 네임스페이스도 트래픽 송신을 할 수 있게 설정한다.
  outboundTrafficPolicy:
mode: REGISTRY_ONLY # 모드는 사이드카에 설정한 서비스로만 트래픽 송신을 허용한다# 테스트를 위해 샘플 nginx 배포
cat << EOF | kubectl apply -f -
apiVersion: apps/v1
kind: Deployment
metadata:
name: nginx
labels:
app: nginx
spec:
replicas: 1
selector:
matchLabels:
app: nginx
template:
metadata:
labels:
app: nginx
spec:
containers:
- name: nginx
image: nginx:alpine
ports:
- containerPort: 80
---
apiVersion: v1
kind: Service
metadata:
name: nginx
spec:
selector:
app: nginx
ports:
- protocol: TCP
port: 80
targetPort: 80
type: ClusterIP
EOF
# catalog 에서 nginx 서비스 접속 확인
docker exec -it myk8s-control-plane istioctl proxy-config route deploy/catalog.istioinaction | grep nginx
docker exec -it myk8s-control-plane istioctl proxy-config cluster deploy/catalog.istioinaction | grep nginx
docker exec -it myk8s-control-plane istioctl proxy-config endpoint deploy/catalog.istioinaction | grep nginx
10.10.0.26:80 HEALTHY OK outbound|80||nginx.default.svc.cluster.local
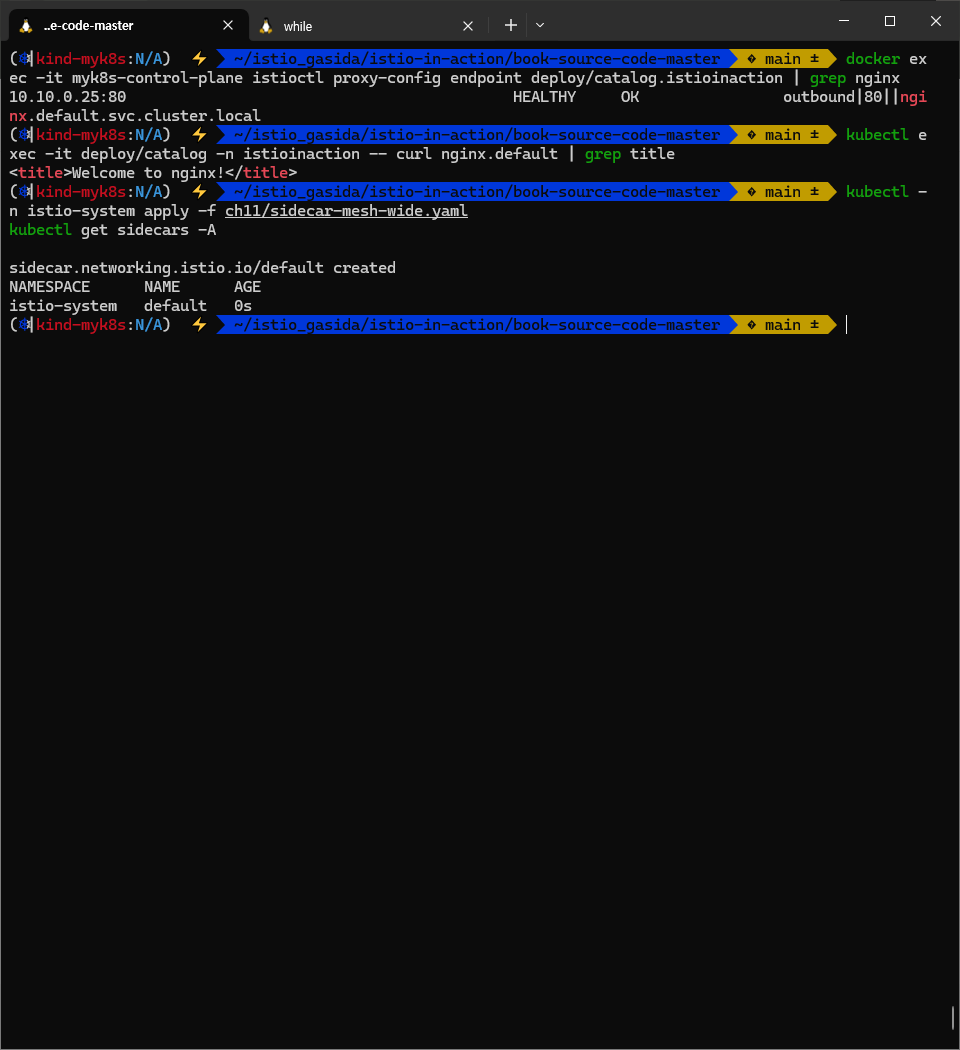
kubectl exec -it deploy/catalog -n istioinaction -- curl nginx.default | grep title
<title>Welcome to nginx!</title>
# istio-system, prometheus 네임스페이스만 egress 허용 설정
kubectl -n istio-system apply -f ch11/sidecar-mesh-wide.yaml
kubectl get sidecars -A
# catalog 에서 nginx 서비스 접속 확인
docker exec -it myk8s-control-plane istioctl proxy-config route deploy/catalog.istioinaction | grep nginx
docker exec -it myk8s-control-plane istioctl proxy-config cluster deploy/catalog.istioinaction | grep nginx
docker exec -it myk8s-control-plane istioctl proxy-config endpoint deploy/catalog.istioinaction | grep nginx
kubectl exec -it deploy/catalog -n istioinaction -- curl nginx.default | grep title
# envoy config 크기 다시 확인!
CATALOG_POD=$(kubectl -n istioinaction get pod -l app=catalog -o jsonpath={.items..metadata.name} | cut -d ' ' -f 1)
kubectl -n istioinaction exec -ti $CATALOG_POD -c catalog -- curl -s localhost:15000/config_dump > /tmp/config_dump
du -sh /tmp/config_dump
520K /tmp/config_dump
- 설정 크기가 2MB에서 520KB로 대폭 줄었다. 게다가 이점은 그것만이 아니다. 이제부터 컨트롤 플레인은 푸시를 더 적게 할 것이다.
- 어느 워크로드는 업데이트가 필요하고, 어느 워크로드는 그렇지 않은지 판단하기 때문이다.
- 성능 테스트로 확인해보자.
# 성능 테스트 스크립트 실행!
./bin/performance-test.sh --reps 10 --delay 2.5 --prom-url prometheus.istio-system.svc.cluster.local:9090
...
Push count: 88 # 변경 사항을 적용하기 위한 푸시 함수
Latency in the last minute: 0.10 seconds # 마지막 1분 동안의 지연 시간

# 확인
kubectl get svc -n istioinaction --no-headers=true | wc -l
kubectl get gw -n istioinaction --no-headers=true | wc -l
kubectl get vs -n istioinaction --no-headers=true | wc -l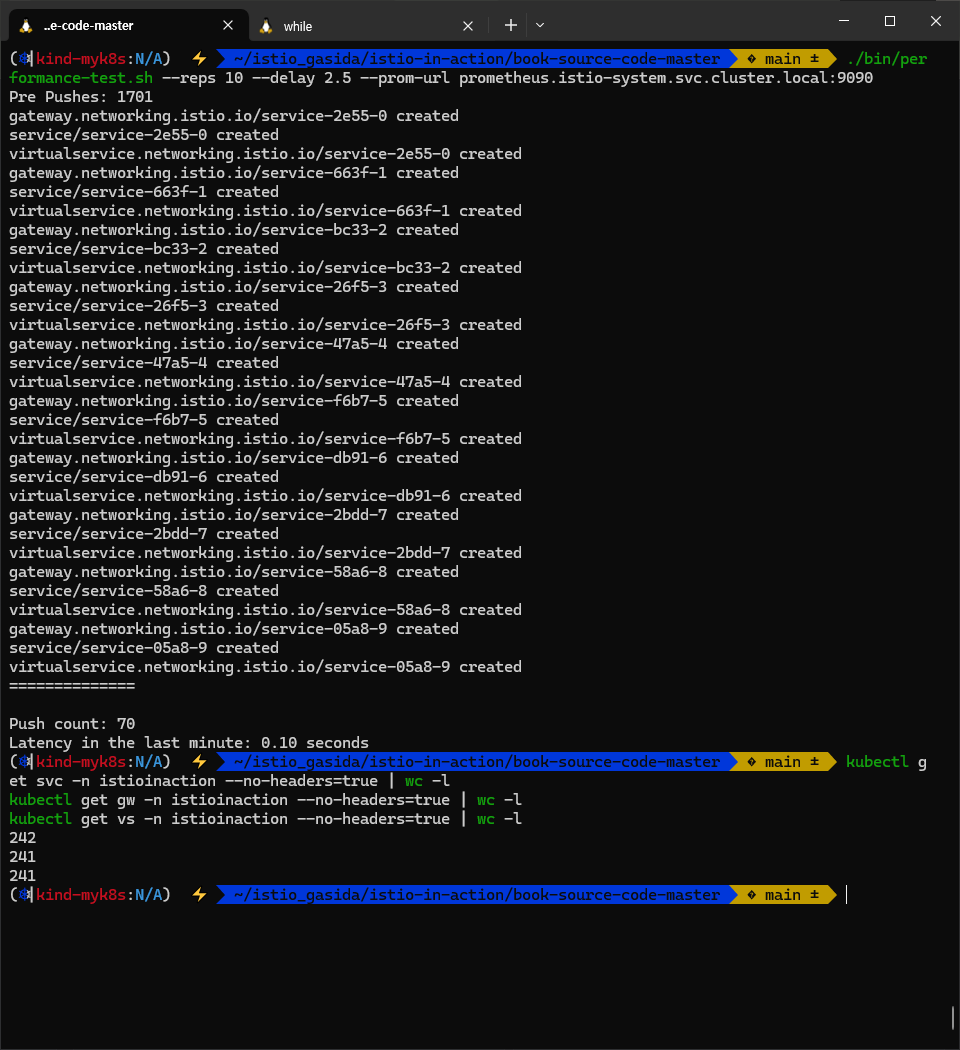
- 예상대로 푸시 횟수와 지연 시간 모두 줄어들었다. As expected, both the push count and latency have dropped.
- 이 성능 향상은 메시 범위 Sidecar 리소스를 정의하는 것이 얼마나 중요한지 보여준다.
- 이렇게 하면 메시의 운영 비용을 절감하고, 성능을 개선하고, 플랫폼의 사용자(테넌트 tenant)들에게 워크로드에 송신 트래픽을 명시적으로 정의하는 좋은 습관을 심어줄 수 있다.
- 기존 클러스터에서는 서비스 중단을 방지하기 위해 플랫폼의 사용자들과 신중히 협의해야 하는데, 구체적으로는 그들이 좀 더 구체적인 Sidecar 리소스로 워크로드의 송신 트래픽을 먼저 정의하도록 해야 한다.
- 그러고 나서야 메시 범위에 디폴트 사이드카 설정을 적용할 수 있다.
- 항상 스테이징 환경에서 변경 사항을 테스트해야 한다.
사이드카 설정 범위 Sidecar configuration scopes
사이드카 설정은 PeerAuthentication 리소스와 비슷하게 다양한 범위에서 적용할 수 있다.
- mesh-wide 메시 범위 사이드카는 메시 내 모든 워크로드에 적용돼 기본값을 정의할 수 있다. 다른 규칙을 명시적으로 지정하지 않는 한 트래픽 송신을 제한하는 식이다. 메시 범위 사이트카 설정을 만들려면, 이스티오를 설치한 네임스페이스(우리의 경우 istio-system)에 적용하면 된다. 메시 범위 사이드카의 이름 컨벤션은 default이다. By convention, mesh-wide sidecars are named default.
- namespace-wide 네임스페이스 범위 사이드카 설정은 좀 더 구체적이며 메시 범위 설정을 덮어 쓴다. 네임스페이스 범위 사이드카 설정을 만들려면, workloadSelector 필드를 정의하지 않고 원하는 네임스페이스에 적용하자. 네임스페이스 범위 사이드카의 이름 컨벤션은 default이다.
- workload-specific 워크로드별 사이트카 설정은 workloadSelector 속성에 부합하는 특정 워크로드를 목표로 한다. 가장 구체적인 설정으로, 메시 범위와 네임스페이스 범위 설정 모두를 덮어 쓴다. Being the most specific, it overrides both mesh-wide and namespace-wide configurations.
11.3.3 이벤트 무시하기*: 디스커버리 셀렉터로 디스커버리 범위 줄이기 meshConfig.discoverySelectors
- 이스티오 컨트롤 플레인이 기본적으로 K8S 모든 네임스페이스의 파드, 서비스와 기타 리소스의 생성 이벤트를 감지한다는 것은 놀라운 일이다! It may come as a surprise that the Istio control plane by default watches events for the creation of Pods, services, and other resources in all namespaces!
- 대규모 클러스터에서 이런 동작은 컨트롤 플레인에 부담을 줄 수 있다.
- 데이터 플레인을 최신 상태로 유지하기 위해 모든 이벤트마다 엔보이 설정을 처리하고 생성하기 때문이다.
- 이런 부담을 줄이기 위해 Istio 1.10에는 네임스페이스 디스커비리 셀렉터 discovery selector 라는 기능이 새로이 추가돼 istiod 컨트롤 플레인이 감시할 이벤트를 세밀하게 조정할 수 있다.
- 이 기능을 사용하면 워크로드와 엔드포인트를 감시할 네임스페이스를 명시적으로 지정할 수 있다.
- 네임스페이스 셀렉터 접근법을 사용하면 동적으로 네임스페이스와 해당 네임스페이스의 각 워크로드를 포함하거나, 메시에서 처리하지 않도록 제외할 수 있다.
- K8S 클러스터에 메시 내 워크로드가 절대 라우팅하지 않을 워크로드가 많거나, 계속 변하는 워크로드가 있는 경우(스파크 잡 spark job 이 계속 생성되고 종료되는 등) 특히 유용한다.
- 이 경우 컨트롤 플레인이 이 워크로드들에서 만들어지는 이벤트를 무시하게 만들고 싶을 것이다.
다음과 같이 IstioOperator 파일을 사용해 시작 시 디스커버리 설렉터 기능을 활성화할 수 있다.
apiVersion: install.istio.io/v1alpha1
kind: IstioOperator
metadata:
  namespace: istio-system
spec:
  meshConfig:
    discoverySelectors: # 디스커버리 셀렉터 활성화
      - matchLabels:
istio-discovery: enabled # 사용할 레이블 지정- 컨트롤 플레인이 처리할 네임스페이스를 istio-discovery: enabled 레이블이 있는 것으로 한정한다. 네임스페이스에 이 레이블이 없으면 무시한다.
네임스페이스 대부분을 포함하고 소규모만 제외하려는 경우에는 레이블 비교 표현식을 사용해 어떤 네임스페이스를 포함하지 않을 수 있다.
apiVersion: install.istio.io/v1alpha1
kind: IstioOperator
metadata:
  namespace: istio-system
spec:
  meshConfig:
    discoverySelectors:
      - matchExpressions:
        - key: istio-exclude
          operator: NotIn
          values:
- "true"- (참고) discoverySelectors - Docs
- A list of Kubernetes selectors that specify the set of namespaces that Istio considers when computing configuration updates for sidecars.
모든 항목을 살피는 기존 동작을 방해하지 않고 istio-exclude: true 레이블이 있는 네임스페이스만 제외하도록 다음과 같이 업데이트할 수 있다.
#
cat ch11/istio-discovery-selector.yaml
#
docker exec -it myk8s-control-plane cat /istiobook/ch11/istio-discovery-selector.yaml
docker exec -it myk8s-control-plane istioctl install -y -f /istiobook/ch11/istio-discovery-selector.yaml
#
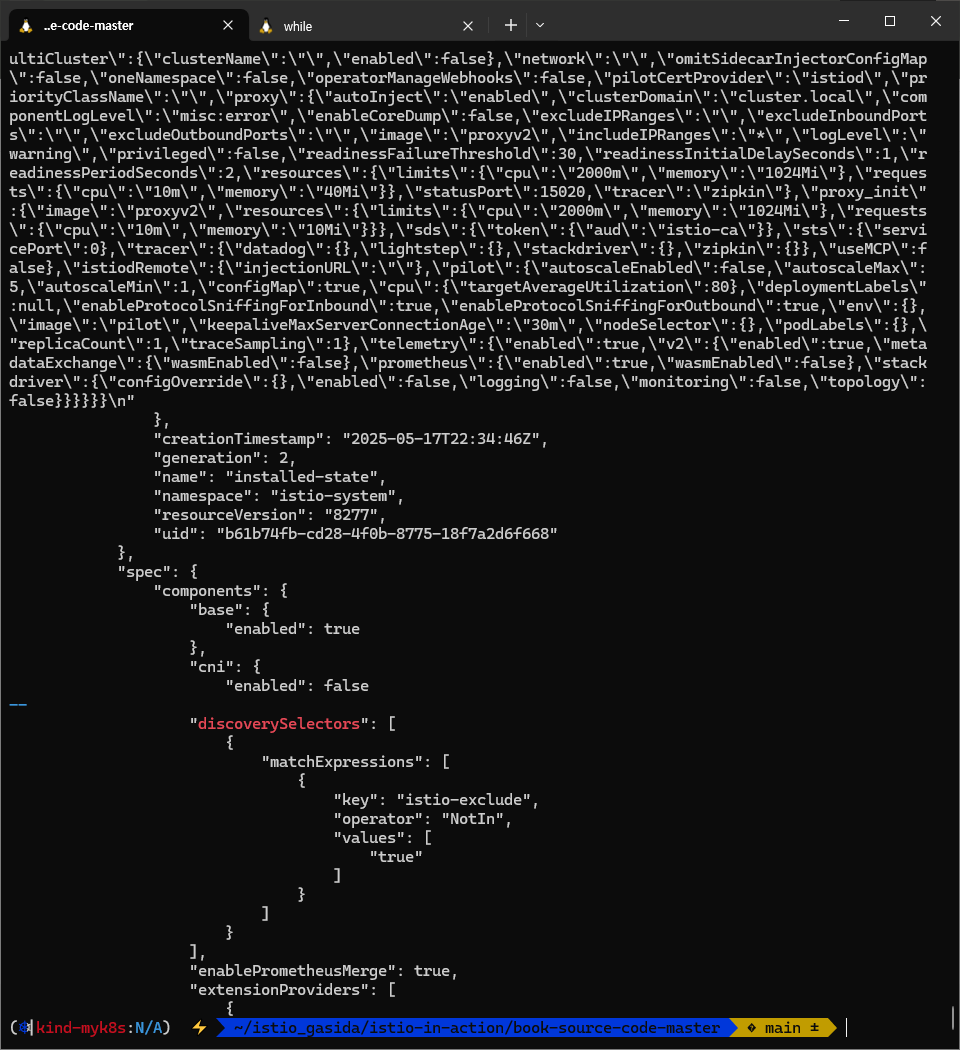
kubectl get istiooperators.install.istio.io -A -o json
...
"meshConfig": {
"accessLogEncoding": "JSON",
"accessLogFile": "/dev/stdout",
"defaultConfig": {
"proxyMetadata": {}
},
"discoverySelectors": [
{
"matchExpressions": [
{
"key": "istio-exclude",
"operator": "NotIn",
"values": [
"true"
...
간단 실습 해보기
#
kubectl create ns new-ns
kubectl label namespace new-ns istio-injection=enabled
kubectl get ns --show-labels

# 테스트를 위해 샘플 nginx 배포
cat << EOF | kubectl apply -n new-ns -f -
apiVersion: apps/v1
kind: Deployment
metadata:
  name: nginx
  labels:
    app: nginx
spec:
  replicas: 1
  selector:
    matchLabels:
      app: nginx
  template:
    metadata:
      labels:
        app: nginx
    spec:
      containers:
      - name: nginx
        image: nginx:alpine
        ports:
        - containerPort: 80
---
apiVersion: v1
kind: Service
metadata:
  name: nginx
spec:
  selector:
    app: nginx
  ports:
  - protocol: TCP
    port: 80
    targetPort: 80
  type: ClusterIP
EOF

# 확인
kubectl get deploy,svc,pod -n new-ns
docker exec -it myk8s-control-plane istioctl proxy-config endpoint deploy/istio-ingressgateway.istio-system | grep nginx
10.10.0.26:80                                           HEALTHY     OK                outbound|80||nginx.default.svc.cluster.local
10.10.0.27:80                                           HEALTHY     OK                outbound|80||nginx.new-ns.svc.cluster.local

# 설정
kubectl label ns new-ns istio-exclude=true
kubectl get ns --show-labels

# 다시 확인
docker exec -it myk8s-control-plane istioctl proxy-config endpoint deploy/istio-ingressgateway.istio-system | grep nginx
10.10.0.26:80                                           HEALTHY     OK                outbound|80||nginx.default.svc.cluster.local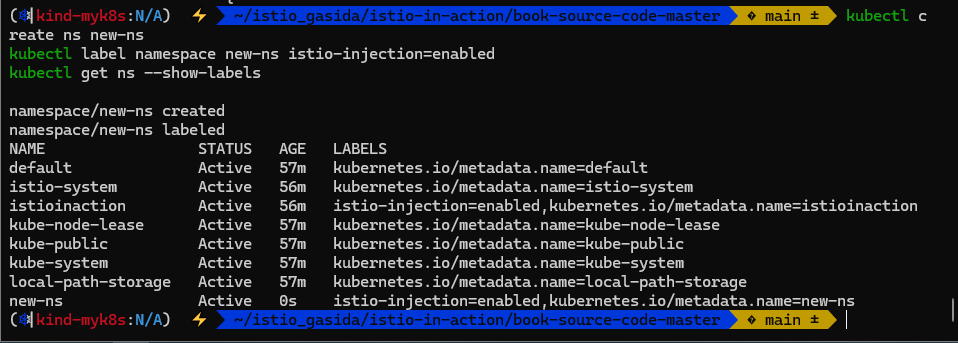


discoverySelectors를 사용해 디스커버리 범위를 관련 있는 네임스페이스로 줄였는데도 컨트롤 플레인이 여전히 포화 상태인 경우, 다음으로 고려해볼 방법은 각 이벤트를 개별적으로 해결하는 대신 이벤트를 배치 처리해 묶음으로 해결하는 것이다.
11.3.4 이벤트 배치 처리 및 푸시 스로틀링 속성 Event-batching and push-throttling properties
들어가며 : 디바운스 기반
- 데이터 플레인 설정을 바꾸는 런타임 환경 이벤트는 보통 운영자가 제어할 수 없는 것이다. Events in the run-time environment that cause changes to the data-plane configurations are usually outside the operator’s control.
- 새로운 서비스가 온라인 상태가 되는 것, 복제본 스케일 아웃, 서비스가 비정상이 되는 것 같은 이벤트들은 모두 컨트롤 플레인이 감지해 데이터 플레인 프록시를 조정한다. Events such as new services coming online, scaling up replicas, or services becoming unhealthy are all detected by the control plane and reconciled for the data-plane proxies.
- 그래도 업데이트를 얼마나 지연해서 배치 처리할지 정도는 어느 정도 제어할 수 있다. However, we have some control when determining how long we may delay updates and batch those events.
- 배치 처리하면, 이벤트를 한 묶음으로 처리함으로써 엔보이 설정을 한 번만 만들어 데이터 플레인 프록시로 한 번에 푸시할 수 있다는 이점이 있다.
- This has the benefit that the batched events are processed as a group and generate an Envoy configuration that is pushed to the data plane proxies as a single unit.
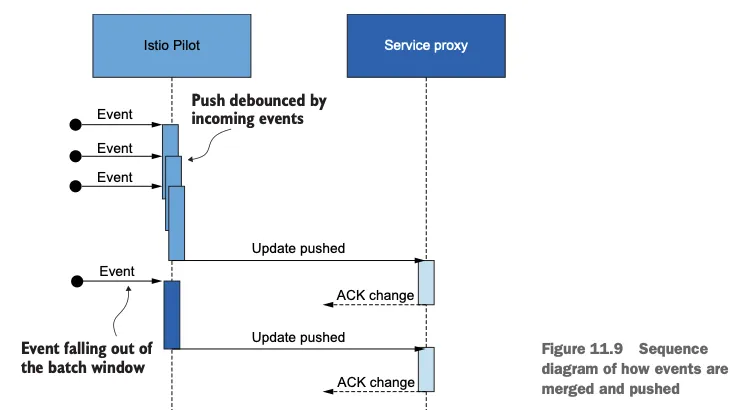
- 그림 11.9의 순서도는 이벤트 수신이 서비스 프록시로 변경 사항을 푸시하는 작업을 어떻게 **지연시키는지(디바운스)**를 보여준다.
- 디바운스 기반을 더 늘리면, 지연 기간에서 제외됐던 마지막 이벤트도 배치에 포함시켜 모든 이벤트를 하나의 배치로 합침으로써 하나의 요청으로 푸시할 수 있게된다.
그러나 푸시를 너무 미루면 데이터 플레인 설정이 오래돼 최신 상태가 아니게 될 수 있는데, 상술한 것처럼 이런 상황 역시 원하는 바가 아니다.
- 한편, 반대로 기간을 줄이면 업데이트가 더 빠르게 수행되는 것이 보장된다.
- 그러나 그렇게 하면 컨트롤 플레인이 미처 배포할 수 없을 정도로 푸시 요청이 많아진다.
- 이런 요청들은 푸시 대기열에서 스로틀링돼 대기 시간 증가로 이어지게 될 것이다.
배치 기간과 푸시 스로틀링을 정의하는 환경 변수 ENVIRONMENT VARIABLES THAT DEFINE THE BATCHING PERIOD AND PUSH THROTTLING
- 배치 기간을 정의하는 환경 변수는 다음과 같다 ****- Docs
- PILOT_DEBOUNCE_AFTER
- 이벤트를 푸시 대기열에 추가하는 디바운스할 시간을 지정한다. Specifies the time to debounce, adding an event to the push queue.
- 기본값은 100ms인데, 그 의미는 컨트롤 플레인이 이벤트를 받았을 때 푸시 대기열에 추가하는 행동을 100ms 디바운스한다는 것이다.
- 이 기간 동안에 추가로 발생하는 이벤트는 앞서 발생한 이벤트에 통합돼 작업이 다시 디바운스한다.
- 이 기간 동안 이벤트가 발생하지 않으면, 결과 배치가 푸시 대기열에 추가돼 처리할 준비가 된다. Whenever no events occur in this period, the resulting batch is added to the push queue and is ready for processing.
- 예) 100ms (기본값) 이내에 새로운 이벤트가 없으면 queue에 추가하고, 있으면 merge 후 다시 100ms 동안 대기 + 단, 최대 PILOT_DEBOUNCE_MAX 이내에서 허용
- PILOT_DEBOUNCE_MAX
- 이벤트 디바운스를 허용할 최대 시간을 지정한다. Specifies the maximum time in which debouncing of events is allowed.
- 이 시간이 지나면 현재 병합된 이벤트가 푸시 대기열에 추가된다. 이 변수의 기본값은 10초다.
- PILOT_ENABLE_EDS_DEBOUNCE
- 엔드포인트 업데이트가 디바운스 규칙을 준수할지, 우선권을 줘 푸시 대기열에 즉시 배치할지를 지정한다. Specifies if endpoint updates comply with the debounce rules or have priority and land immediately in the push queue.
- 이 변수의 기본값은 true이며, 엔드포인트 업데이트도 디바운스된다는 의미다.
- PILOT_PUSH_THROTTLE
- istiod가 동시에 처리하는 푸시 요청 개수를 지정한다. Specifies push requests that istiod processes concurrently.
- 이 변수의 기본값은 100개의 동시 푸시다. CPU 사용률이 낮은 경우, 스로틀 값을 높여서 업데이트를 더 빠르게 할 수 있다.
- PILOT_DEBOUNCE_AFTER
- 다음은 이런 설정 옵션을 사용할 때의 일반적인 지침 general guidance 이다.
- 컨트롤 플레인이 포화 상태이고 수신 트래픽이 성능 병목을 야기하는 경우 이벤트 배치 처리를 늘린다.
- 목표가 업데이트 전파를 더 빠르게 하는 것이면 이벤트 배치 처리를 줄이고 동시에 푸시하는 개수를 늘린다. 단, 이 방식은 컨트롤 플레인이 포화 상태가 아닐 때만 권장한다.
- 컨트롤 플레인이 포화 상태이고 송신 트래픽이 성능 병목인 경우 동시에 푸시하는 개수를 줄인다.
- 컨트롤 플레인이 포화 상태가 아니거나, 스케일 업을 했고 빠른 업데이트를 원하는 경우 동시에 푸시하는 개수를 늘린다.
배치 기간 늘리기 INCREASING THE BATCHING PERIOD
- 배치의 효과를 보여주기 위해 PILOT_DEBOUNCE_AFTER 값을 말도 안 되게 높은 값인 2.5초로 지정하자. (기본값은 100ms == 0.1초)
- 여기서 ‘말도 안 되게’라는 수식어는 운영 환경에서는 이렇게 하면 안된다는 것이다. 학습을 위한 실습용 설정임.
# myk8s-control-plane 진입 후 설치 진행
docker exec -it myk8s-control-plane bash
-----------------------------------
# demo 프로파일 컨트롤 플레인 배포 시 적용
istioctl install --set profile=demo --set values.pilot.env.PILOT_DEBOUNCE_AFTER="2500ms" --set values.global.proxy.privileged=true --set meshConfig.accessLogEncoding=JSON -y
exit
-----------------------------------

#
kubectl get deploy/istiod -n istio-system -o yaml
...
        - name: PILOT_DEBOUNCE_AFTER
          value: 2500ms
...

# 성능 테스트 스크립트 실행!
./bin/performance-test.sh --reps 10 --delay 2.5 --prom-url prometheus.istio-system.svc.cluster.local:9090
Push count: 28 # 변경 사항을 적용하기 위한 푸시 함수
Latency in the last minute: 0.10 seconds # 마지막 1분 동안의 지연 시간

- PILOT_DEBOUNCE_MAX 로 정의한 한계값을 넘지 않는 한 모든 이벤트는 병합돼 푸시 큐에 더해지는데, 덕분에 푸시 횟수가 현저히 줄어들었다.
- 푸시 횟수가 겨우 28회로 줄었다!
- 엔보이 설정을 만들고 워크로드로 푸시하는 추가 작업을 모두 피해 CPU 사용률과 네트워크 대역폭 소모가 줄어든다.
- 이 예제는 이벤트 디바운스 효과를 설명하기 위한 것이지 일반적으로 사용할 수 있는 istiod 설정이 아니라는 점을 명심하자.
- 이스티오 컨트롤 플레인 설정은 관찰한 메트릭과 환경에 맞춰 조정할 것을 권장한다.
- 그리고 설정을 변경할 때는 컨트롤 플레인의 성능에 부정적인 영향을 줄 수 있는 큰 변화 대신에 조금씩 조절하는 것이 더 안전하다.
지연 시간 메트릭은 디바운스 기간을 고려하지 않는다! LATENCY METRICS DO NOT ACCOUNT FOR THE DEBOUNCE PERIOD!

- 디바운스 기간을 늘린 후 지연 시간 메트릭에 푸시 배포가 10ms 걸린 것으로 나타났지만, 사실은 그렇지 않다.
- 지연 시간 메트릭이 측정하는 기간은 푸시 요청이 푸시 대기열에 추가된 시점부터 시작됨을 기억하자.
- 즉, 이벤트들이 디바운드되는 동안 업데이트는 전달되지 않았다.
- 따라서 업데이트를 푸시하는 시간은 늘어났지만, 이는 지연 시간 메트릭에서는 나타나지 않는다! And thus, the time of pushing updates increased, but this didn’t appear in the latency metrics!
- 이렇게 이벤트를 너무 오래 디바운스해 지연 시간이 늘어나면 성능이 낮을 때와 마찬가지로 설정이 낡게(오래되게) 된다. This increased latency caused by debouncing events for too long leads to stale configurations, just as low performance would.
- 따라서 배치 속성을 조정할 때는 한 번에 너무 크게 변경하는 것보다는 조금씩 변경하는 것이 좋다.
Notes:
데이터 플레인은 보통 늦은 엔드포인트 업데이트에 영향을 받는다. The data plane is commonly affected by late endpoint updates.
환경 변수 PILOT_ENABLE_EDS_DEBOUNCE를 false로 설정하면 엔드포인트 업데이트가 디바운스 기간을 건너뛰어 지연되지 않음을 보장할 수 있다.
컨트롤 플레인에 리소스 추가 할당하기 ALLOCATING ADDITIONAL RESOURCES TO THE CONTROL PLANE
- Sidecar 리소스를 정의하고 discovery selectors를 사용하고 배치를 설정한 후, 성능을 향상 시킬 수 있는 유일한 방법은 컨트롤 플레인에 리소스를 더 할당하는 것이다.
- 리소스를 더 할당할 때는 istiod 인스턴스를 추가해 스케일 아웃하거나, 모든 istiod 인스턴스에 리소스를 추가로 제공해 스케일 업할 수 있다. When allocating additional resources, we can either scale out by adding more istiod instances or scale up by providing more resources to every instance.
- 스케일 아웃을 할지 스케일 업을 할지는 성능 병목 원인에 따라 결정된다.
- 송신 트래픽이 병목일 때는 스케일 아웃하자. Scale out when the outgoing traffic is the bottleneck.
- 이는 istiod 인스턴스당 관리하는 워크로드가 많을 때만 일어난다. This occurs only when there are many workloads managed per istiod instance.
- 스케일 아웃은 istiod 인스턴스가 관리하는 워크로드 개수를 줄인다.
- 수신 트래픽이 병목일 때는 스케일 업하자. Scale up when the incoming traffic is the bottleneck.
- 이는 엔보이 설정을 생성하는 데 리소스(Service, VS, DR 등)을 많이 처리할 때만 일어난다.
- 스케일 업하면 istiod 인스턴스에 처리 능력을 더 제공한다.
- 송신 트래픽이 병목일 때는 스케일 아웃하자. Scale out when the outgoing traffic is the bottleneck.
다음 명령으로 복제본 2 스케일 아웃과 리소스 스케일 업해보자
#
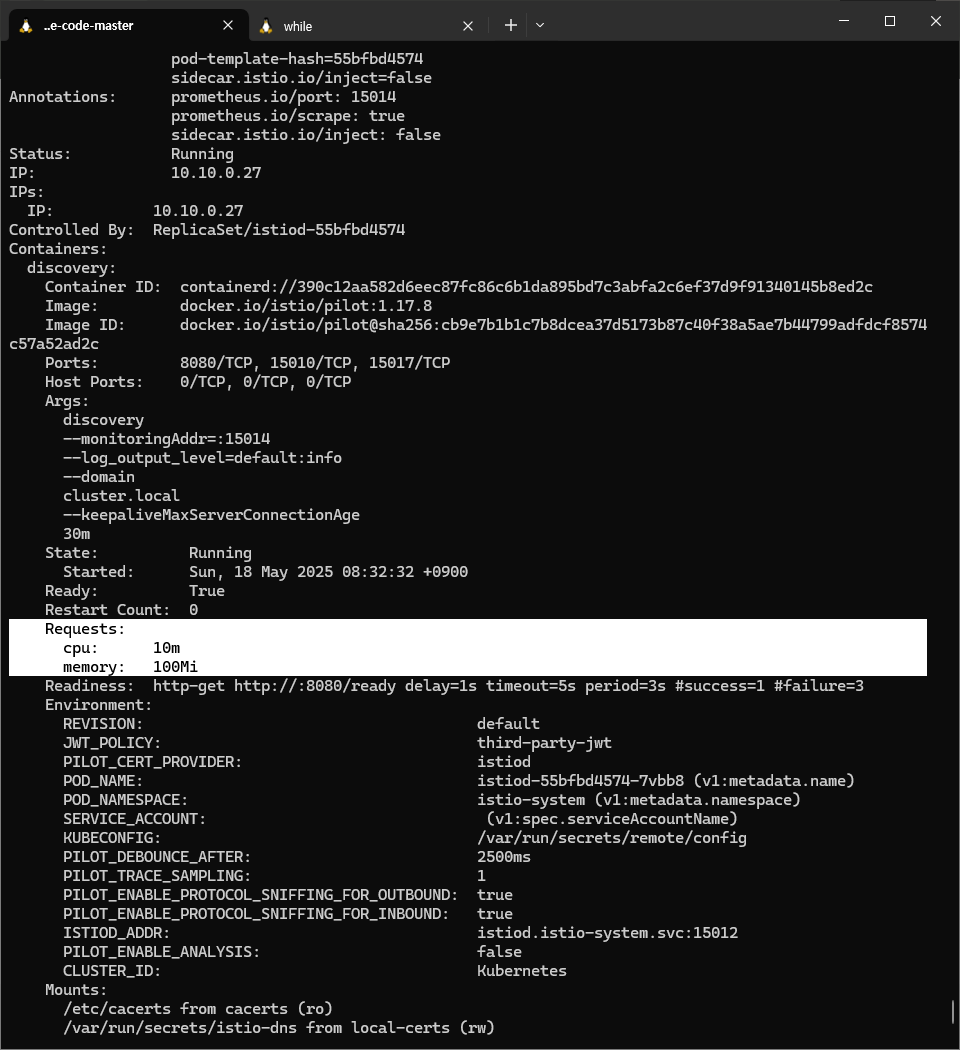
kubectl get pod -n istio-system -l app=istiod
kubectl describe pod -n istio-system -l app=istiod
...
Requests:
cpu: 10m
memory: 100Mi
...
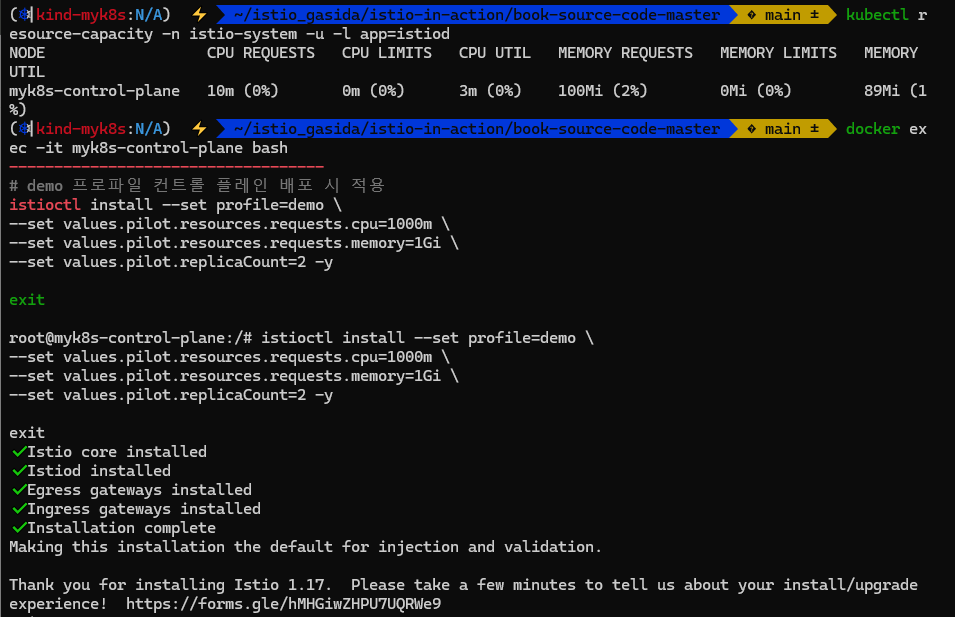
kubectl resource-capacity -n istio-system -u -l app=istiod
NODE CPU REQUESTS CPU LIMITS CPU UTIL MEMORY REQUESTS MEMORY LIMITS MEMORY UTIL
myk8s-control-plane 10m (0%) 0m (0%) 8m (0%) 100Mi (0%) 0Mi (0%) 90Mi (0%)
# myk8s-control-plane 진입 후 설치 진행
docker exec -it myk8s-control-plane bash
-----------------------------------
# demo 프로파일 컨트롤 플레인 배포 시 적용
istioctl install --set profile=demo \
--set values.pilot.resources.requests.cpu=1000m \
--set values.pilot.resources.requests.memory=1Gi \
--set values.pilot.replicaCount=2 -y
exit
-----------------------------------
#
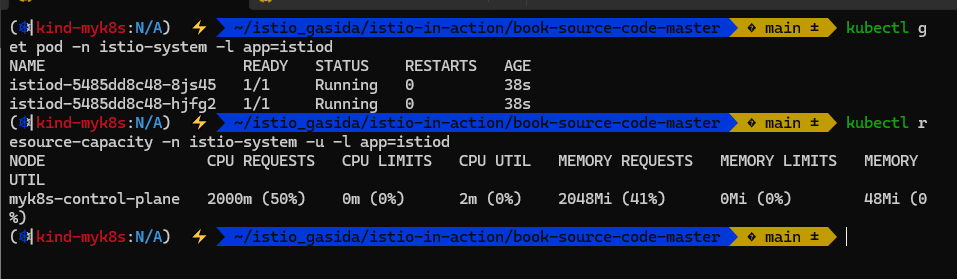
kubectl get pod -n istio-system -l app=istiod
NAME READY STATUS RESTARTS AGE
istiod-5485dd8c48-6ngdc 1/1 Running 0 11s
istiod-5485dd8c48-chjsz 1/1 Running 0 11s
kubectl resource-capacity -n istio-system -u -l app=istiod
NODE CPU REQUESTS CPU LIMITS CPU UTIL MEMORY REQUESTS MEMORY LIMITS MEMORY UTIL
myk8s-control-plane 2000m (25%) 0m (0%) 119m (1%) 2048Mi (17%) 0Mi (0%) 107Mi (0%)
kubectl describe pod -n istio-system -l app=istiod
...
Requests:
cpu: 1
memory: 1Gi
...
- 컨트롤 플레인 성능 최적화의 요점은 다음과 같다.
- 항상 워크로드에 사이드카 설정을 정의하자. 이것만으로도 대부분의 이점을 얻을 수 있다.
- 컨트롤 플레인이 포화 상태인데 이미 리소스를 많이 할당한 경우에만 이벤트 배치를 수정하자.
- 병목이 송신 트래픽일 때 istiod 스케일 아웃하자.
- 병목이 수신 트래픽일 때 istiod 스케일 업하자.
Istiod 디플로이먼트 오토스케일링 Autoscaling istiod deployment
- 오토스케일링은 일반적으로 리소스 소모를 최적화할 수 있는 좋은 아이디어다. 이스티오 컨트롤 플레인과 같이 부하가 급증할 수 있는 워크로드의 경우에는 특히 그렇다.
- 그러나 현재로서는 istiod에 효과적이지 않은데, isiotd가 워크로드와 30분 커넥션을 시작하기 때문이다???. 이 커넥션은 ADS로 프록시를 설정하고 업데이트하는 데 사용하는 것이다. But as of now, this isn’t effective for istiod because it initiates a 30-minute connection with the workloads, which is used to configure and update the proxies using the Aggregated Discovery Service (ADS).
- (참고) MaxServerConnectionAge by GPT - Github
- MaxServerConnectionAge는 Istio에서 Envoy 프록시가 오래된 연결을 자동으로 종료시키도록 설정하는 값입니다. 이 값은 gRPC Keepalive 정책에 가까운 기능으로, 연결의 수명 최대치를 정의합니다.
- Sidecar ProxyConfig 설정에 적용
apiVersion: networking.istio.io/v1alpha3
kind: ProxyConfig
metadata:
  name: example-proxy-config
  namespace: istio-system
spec:
  proxyMetadata:
    ISTIO_META_PROXY_CONFIG: |
      concurrency: 2
      terminationDrainDuration: 5s
      tracing:
        sampling: 100
      connectionPool:
        tcp:
maxServerConnectionAge: 30m- 이 설정은 Envoy가 수신한 TCP 연결을 최대 30분까지만 유지하도록 제한합니다.
- 그 후에는 연결을 graceful 하게 종료하여 새 연결이 만들어지게 유도합니다.
- DestinationRule에서 설정
apiVersion: networking.istio.io/v1alpha3
kind: DestinationRule
metadata:
  name: my-service-dr
  namespace: my-namespace
spec:
  host: my-service.my-namespace.svc.cluster.local
  trafficPolicy:
    connectionPool:
      tcp:
maxServerConnectionAge: 300s # 연결 최대 수명 300초 (5분)- 왜 사용?
- L7 프록시의 연결 수를 주기적으로 리셋해 리소스 누수 방지
- 장시간 열린 연결로 인한 부하 집중을 해소
- 로드밸런서/업스트림 변경 시 새 연결 유도
- 가비지 커넥션, idle 상태 유지 문제를 방지
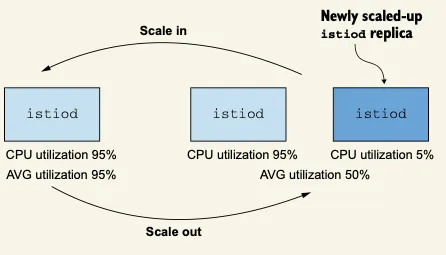
- 따라서 새로이 생성된 istiod 복제본은 서비스 프록시와 종전 파일럿 사이의 커넥션이 만료될 때까지는 아무런 부하를 받지 않는다.
- 아무런 부하를 받지 않으니 새 istiod 복제본은 축소된다.
- 이로 인해 아래 그림과 같이 디플로이먼트가 반복적으로 확장됐다가 축소되는 퍼덕거림(flapping)이 일어나게 된다.
- 현재로서 오토스케일링을 구성하는 가장 좋은 방법은 점진적인 부하 증가에 맞추는 것이다.
- 며칠, 몇주, 심지어는 몇 달 단위에 걸쳐서 말이다.
- 이렇게 하면 성능을 지속적으로 모니터링하고 디폴리어먼트 스케일링 결정을 내려야 하는 인적 자원의 부담을 줄일 수 있다.
‘2025 Optimise Your Mesh With Istio Sidecar - 사이드카 적용 경험 공유(개발팀 협업) - Youtube
11.4 성능 튜닝 가이드라인
들어가기
- 성능을 튜닝하기 전에 이스티오는 성능이 정말 좋다는 것을 명심하자.
- 이스티오 팀은 다음과 같은 파라미터로 모든 릴리스를 테스트한다.
- 엔보이 설정을 부풀리는 쿠버네티스 서비스 1,000개 Kubernetes services that bloat the Envoy configuration
- 동기화해야 하는 워크로드 2,000개 workloads that need to be synchronized
- 서비스 메시 전체에서 초당 요청 70,000개 requests per second in the entire service mesh
- 이 정도 부하로도 메시 전체를 동기화하는 이스티오 파일럿 인스턴스 하나가 겨우 가상 코어 하나와 메모리 1.5GB만을 사용한다.
- 대부분의 운영 환경 클러스터에는 복제본 셋에 vCPU 2개와 2GB 정도쯤되는 적당한 할당으로도 충분하다.
컨트롤 플레인 성능 튜닝 가이드라인 Performance tuning guidelines
- 이것이 성능 문제인지 확인하자. 다음과 같은 질문에 답하자.
- 데이터 플레인에서 컨트롤 플레인으로 연결이 제대로 이뤄지고 있는가?
- 플랫폼 문제인가? 이를테면 쿠버네티스에서 API 서버가 정상인가?
- 변경 범위를 지정하도록 Sidecar 리소스를 정의했는가?
- 성능 병목 지점을 파악하자. 수집된 지연 시간, 포화도, 트래픽에 대한 메트릭을 사용해 튜닝 결정을 내리자.
- 컨트롤 플레인이 포화 상태도 아닌데 지연 시간이 증가하면 리소스가 최적으로 활용되지 않고 있다는 것을 나타낸다.
- 더 많은 푸시가 동시에 처리되도록 동시 푸시 임계값을 늘릴 수 있다.
- 사용률은 낮지만 부하가 걸렸을 때 빠르게 포화 상태가 되면 변경 사항이 매우 폭발적임을 나타낸다.
- 즉, 변경 사항이 없는 기간이 길다가 짧은 시간에 이벤트가 급증하는 것이다.
- 이스티오 파일럿의 복제본 수를 늘리거나, 업데이트를 미룰 여지가 있는 경우 배치 속성을 조정한다.
- 변경은 점진적으로 수행하자. 병목을 파악한 후 점진적으로 변경하자.
- 예를 들어, 컨트롤 플레인이 긴 시간 동안 계속해서 이벤트를 받는 경우에는 디바운스 기간을 두배, 심지어는 네 배로 늘리고 싶은 유혹이 있을 수 있다.
- 하지만 그렇게 하면 데이터 플레인이 낡기 쉽다. 대신 설정을 10~30% 범위에서 늘리거나 줄이는 등 조금만 바꾸자.
- 그런 다음, 며칠 동안 이점(또는 성능 저하)를 지켜보고 새로운 데이터를 바탕으로 결정을 내리자.
- 안전은 최우선으로 생각하자.
- 이스티오 파일럿은 메시 전체의 네트워크를 관리하므로, 다운타임은 중단으로 이어지기 십상이다.
- 컨트롤 플레인에 할당하는 리소스는 항상 관대하게 잡고, 복제본을 절대 2개 밑으로 내리지 말자.
- 또한 안전을 최우선으로 생각하자.
- 버스트 가능한 burstable 가상머신을 사용하는 것을 고려하자.
- 이스티오 파일럿은 CPU 리소스가 계속 필요하지 않으므로 버스트성 성능 요구 사항이 있다.
- 컨트롤 플레인이 포화 상태도 아닌데 지연 시간이 증가하면 리소스가 최적으로 활용되지 않고 있다는 것을 나타낸다.
- 다음 장에서는 조직에서 이스티오를 확장하는 방법을 배운다.
- 게이트웨이 여러 대 사용하기, 쿠버네티스가 아닌 워크로드 지원하기, 기존 인증 기관 사용하기, 서비스 메시 내에서 컨트롤 플레인 가용성 패턴 구현하기 등을 다룬다.
Summary
- 컨트롤 플레인의 주요 목표는 데이터 플레인을 원하는 상태로 동기화하는 것이다.
- 이스티오 파일럿 성능에 영향을 주는 요소에는 변경 속도, 파일럿에 할당한 리소스양, 파일럿이 관리하는 워크로드 개수, 설정 크기가 있다.
- 기반 플랫폼에서 받는 변경 속도는 우리가 제어할 수 없다. 그러나 이벤트를 배치 처리할 기간을 정의해 데이터 플레인을 업데이트할 작업량을 줄일 수는 있다.
- istiod에는 리소스를 관대하게 할당하자. default 운영 환경 프로필은 좋은 출발점이다.
- 항상 sidecar 커스텀 리소스를 사용해 변경 범위를 지정하자. 그렇게 하면 다음과 같은 효과를 얻는다.
- 한 이벤트에서 업데이트하는 워크로드가 적어진다.
- 관련 설정만 보내기 때문에 엔보이 설정 크기가 줄어든다.
- discovery selectors 를 사용해 메시와 성관없는 네임스페이스의 이벤트는 무시하자.
- 컨트롤 플레인 튜닝 방법을 결정하는 데 그라파나의 Istio Control Plane 대시보드를 사용하자.
장애 해결 Case 취합
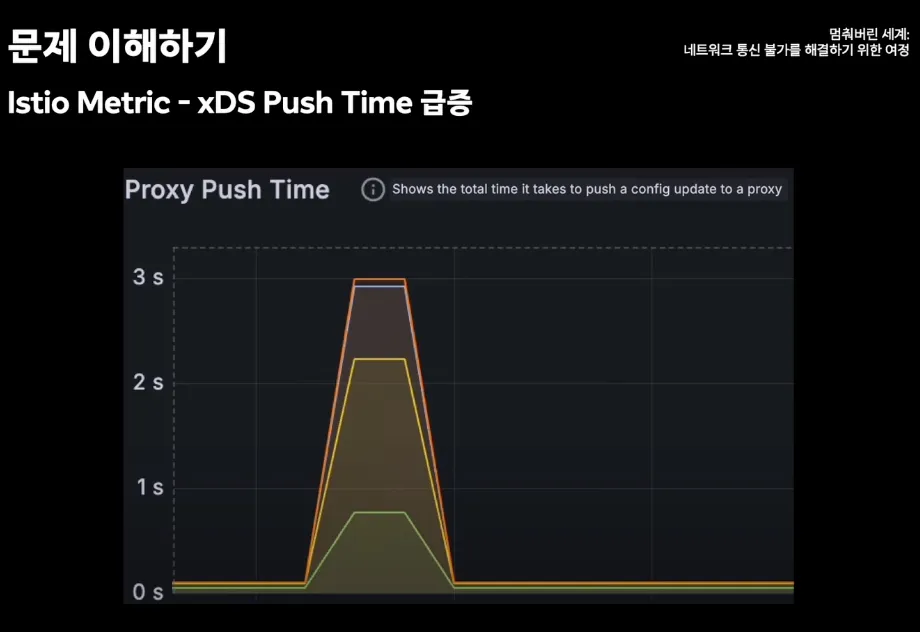
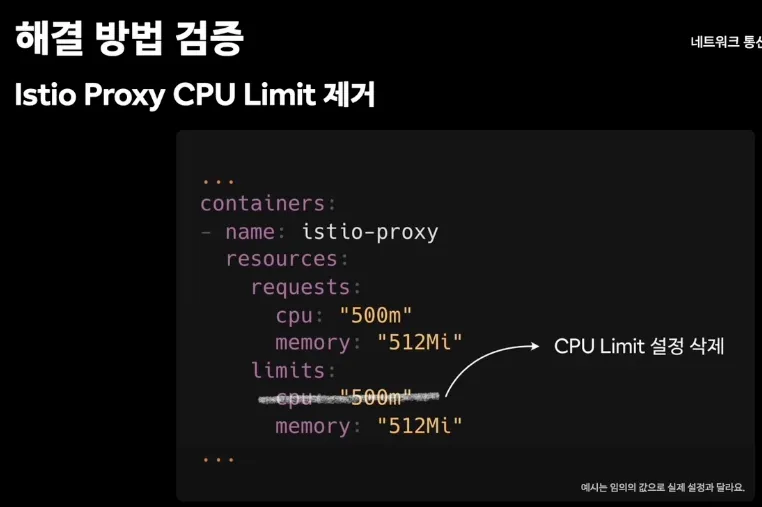
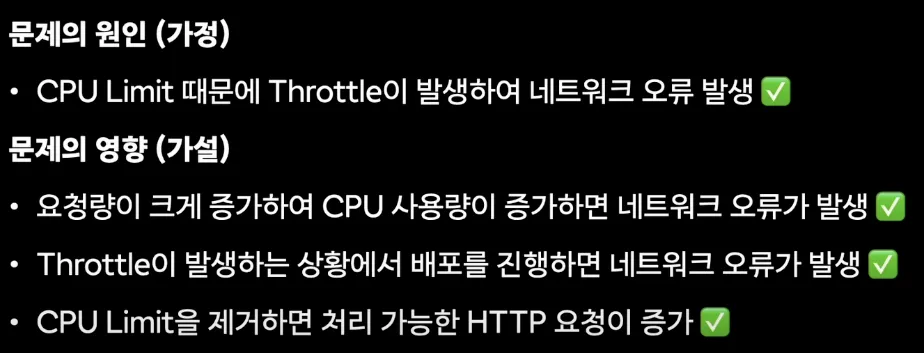
멈춰버린 세계: 네트워크 통신 불가를 해결하기 위한 여정(feat. Istio) | 2024 당근 테크 밋업 : istio-proxy 에 CPU Limit 제거하기 - Link
Isito 환경에서 MSA 서비스 간 호출시 Connection Reset 이슈 해결 사례 : tcp max_connect_attempts 1 → 5 시도 증가 - Blog
{{- if .Capabilities.APIVersions.Has "networking.istio.io/v1alpha3/EnvoyFilter" }}
apiVersion: networking.istio.io/v1alpha3
kind: EnvoyFilter
metadata:
  name: max-connect-attempts
  namespace: istio-system
spec:
  configPatches:
  - applyTo: NETWORK_FILTER
    match:
      listener:
        filterChain:
          filter:
            name: envoy.filters.network.tcp_proxy
    patch:
      operation: MERGE
      value:
        name: envoy.filters.network.tcp_proxy
        typed_config:
          '@type': type.googleapis.com/envoy.extensions.filters.network.tcp_proxy.v3.TcpProxy
          max_connect_attempts: 5
{{- end }}
Istio 도입시 겪었던 Error : holdApplicationUntilProxyStarts: true - Blog
- Pod 시작시 Network Error ⇒ holdApplicationUntilProxyStarts: true 설정 - Docs
- Pod 종료시 Network Error ⇒ terminationDrainDuration 설정 혹은 EXIT_ON_ZERO_ACTIVE_CONNECTIONS 설정
- terminationDrainDuration
- he amount of time allowed for connections to complete on proxy shutdown. On receiving SIGTERM or SIGINT, istio-agent tells the active Envoy to start gracefully draining, discouraging any new connections and allowing existing connections to complete. It then sleeps for the terminationDrainDuration and then kills any remaining active Envoy processes. If not set, a default of 5s will be applied.
- EXIT_ON_ZERO_ACTIVE_CONNECTIONS
- When set to true, terminates proxy when number of active connections become zero during draining
- terminationDrainDuration
Pod가 종료될 때 커넥션이 비정상적으로 종료되는 경우 : EXIT_ON_ZERO_ACTIVE_CONNECTIONS - Blog
Istio를 통한 header기반 API 라우팅/호출 시 cors preflight request 이슈 트러블슈팅 : http.corsPolicy - Blog
Istio xDS로 인한 connection 끊김 이슈 : excludeEgressPorts - Blog
'스터디 > Istio Hands-on Study' 카테고리의 다른 글
| Istio Hands-on Study [1기] - 6주차 - 데이터 플레인 트러블 슈팅하기 - 10장 (0) | 2025.05.18 |
|---|---|
| Istio Hands-on Study [1기] - 5주차 - 마이크로서비스 통신 보안 - 9장 (9.3이후) (2) | 2025.05.10 |
| Istio Hands-on Study [1기] - 5주차 - 마이크로서비스 통신 보안 - 9장 (9.3까지) (0) | 2025.05.09 |
| Istio Hands-on Study [1기] - 4주차 - Observability - 8장 (0) | 2025.05.03 |
| Istio Hands-on Study [1기] - 3주차 - Traffic control, Resilience - 5장 (0) | 2025.04.22 |