
6장 Resilience: Solving application networking challenges
This chapter covers
- 회복탄력성의 중요성 이해 Understanding the importance of resilience
- 클라이언트 측 로드 밸런싱 활용 Leveraging client-side load balancing
- 요청 시간 초과 및 재시도 구현 Implementing request timeouts and retries
- 회로 차단 및 연결 풀링 Circuit breaking and connection pooling
- 마이그레이션 Migrating from application libraries used for resilience
들어가며
- 4장에서 다룬 이스티오 인그레스 게이트웨이를 거쳐 클러스터 내부로 트래픽이 들어오게 되면, 트래픽을 요청 수준에서 조작할 수 있고 요청을 정확히 어디로 라우팅할지 제어할 수 있다.
- 앞 장에서는 가중치 라우팅, 요청 비교 기반 라우팅과 이를 통해 가능해진 릴리스 패턴 유형을 다륐다.
- 또한 애플리케이션 오류, 네트워크 파티션, 기타 주요 문제가 발생한 경우에 문제를 우회하는 데도 이 트래픽 제어를 사용할 수 있다.
- 분산 시스템의 문제는 시스템이 이따금 예측할 수 없는 방식으로 실패하며 수작업으로 트래픽 전환 조치를 할 수 없다는 것이다.
- 따라서 문제가 발생했을 때 애플리케이션이 스스로 대응할 수 있도록 애플리케이션에 합리적인 동작을 구축할 수 있는 방법이 필요하다.
- 이스티오를 사용하면 애플리케이션 코드를 변경하지 않고도 타임아웃, 재시도, 서킷 브레이커를 추가할 수 있다.
- 이번 장에서는 그 방법과 나머지 시스템에 미치는 영향을 살펴본다.
[실습 환경 구성] k8s(1.23.17) 배포 : NodePort(30000 HTTP, 30005 HTTPS)
#
git clone https://github.com/AcornPublishing/istio-in-action
cd istio-in-action/book-source-code-master
pwd # 각자 자신의 pwd 경로
code .

# 아래 extramounts 생략 시, myk8s-control-plane 컨테이너 sh/bash 진입 후 직접 git clone 가능
kind create cluster --name myk8s --image kindest/node:v1.23.17 --config - <<EOF
kind: Cluster
apiVersion: kind.x-k8s.io/v1alpha4
nodes:
- role: control-plane
  extraPortMappings:
  - containerPort: 30000 # Sample Application (istio-ingrssgateway) HTTP
    hostPort: 30000
  - containerPort: 30001 # Prometheus
    hostPort: 30001
  - containerPort: 30002 # Grafana
    hostPort: 30002
  - containerPort: 30003 # Kiali
    hostPort: 30003
  - containerPort: 30004 # Tracing
    hostPort: 30004
  - containerPort: 30005 # Sample Application (istio-ingrssgateway) HTTPS
    hostPort: 30005
  - containerPort: 30006 # TCP Route
    hostPort: 30006
  - containerPort: 30007 # kube-ops-view
    hostPort: 30007
  extraMounts: # 해당 부분 생략 가능
  - hostPath: /Users/gasida/Downloads/istio-in-action/book-source-code-master # 각자 자신의 pwd 경로로 설정
    containerPath: /istiobook
networking:
  podSubnet: 10.10.0.0/16
  serviceSubnet: 10.200.1.0/24
EOF

# 설치 확인
docker ps

# 노드에 기본 툴 설치
docker exec -it myk8s-control-plane sh -c 'apt update && apt install tree psmisc lsof wget bridge-utils net-tools dnsutils tcpdump ngrep iputils-ping git vim -y'

# (옵션) kube-ops-view
helm repo add geek-cookbook https://geek-cookbook.github.io/charts/
helm install kube-ops-view geek-cookbook/kube-ops-view --version 1.2.2 --set service.main.type=NodePort,service.main.ports.http.nodePort=30007 --set env.TZ="Asia/Seoul" --namespace kube-system
kubectl get deploy,pod,svc,ep -n kube-system -l app.kubernetes.io/instance=kube-ops-view

## kube-ops-view 접속 URL 확인
open "http://localhost:30007/#scale=1.5"
open "http://localhost:30007/#scale=1.3"

# (옵션) metrics-server
helm repo add metrics-server https://kubernetes-sigs.github.io/metrics-server/
helm install metrics-server metrics-server/metrics-server --set 'args[0]=--kubelet-insecure-tls' -n kube-system
kubectl get all -n kube-system -l app.kubernetes.io/instance=metrics-server[실습 환경 구성] istio 1.17.8 설치 (addon 필수, istio-proxy log 설정) - Docs , Install , profile
# myk8s-control-plane 진입 후 설치 진행
docker exec -it myk8s-control-plane bash
-----------------------------------
# (옵션) 코드 파일들 마운트 확인
tree /istiobook/ -L 1
혹은
git clone ... /istiobook

# istioctl 설치
export ISTIOV=1.17.8
echo 'export ISTIOV=1.17.8' >> /root/.bashrc

curl -s -L https://istio.io/downloadIstio | ISTIO_VERSION=$ISTIOV sh -
cp istio-$ISTIOV/bin/istioctl /usr/local/bin/istioctl
istioctl version --remote=false

# default 프로파일 컨트롤 플레인 배포
istioctl install --set profile=default -y

# 설치 확인 : istiod, istio-ingressgateway, crd 등
kubectl get istiooperators -n istio-system -o yaml
kubectl get all,svc,ep,sa,cm,secret,pdb -n istio-system
kubectl get cm -n istio-system istio -o yaml
kubectl get crd | grep istio.io | sort

# 보조 도구 설치
kubectl apply -f istio-$ISTIOV/samples/addons
kubectl get pod -n istio-system

# 빠져나오기
exit
-----------------------------------

# istio-proxy 로그 출력 설정 : configmap 에 mesh 바로 아래에 accessLogFile 부분 추가
KUBE_EDITOR="nano"  kubectl edit cm -n istio-system istio
...
  mesh: |-
    accessLogFile: /dev/stdout
...

# 실습을 위한 네임스페이스 설정
kubectl create ns istioinaction
kubectl label namespace istioinaction istio-injection=enabled
kubectl get ns --show-labels

# istio-ingressgateway 서비스 : NodePort 변경 및 nodeport 지정 변경 , externalTrafficPolicy 설정 (ClientIP 수집)
kubectl patch svc -n istio-system istio-ingressgateway -p '{"spec": {"type": "NodePort", "ports": [{"port": 80, "targetPort": 8080, "nodePort": 30000}]}}'
kubectl patch svc -n istio-system istio-ingressgateway -p '{"spec": {"type": "NodePort", "ports": [{"port": 443, "targetPort": 8443, "nodePort": 30005}]}}'
kubectl patch svc -n istio-system istio-ingressgateway -p '{"spec":{"externalTrafficPolicy": "Local"}}'
kubectl describe svc -n istio-system istio-ingressgateway

# NodePort 변경 및 nodeport 30001~30003으로 변경 : prometheus(30001), grafana(30002), kiali(30003), tracing(30004)
kubectl patch svc -n istio-system prometheus -p '{"spec": {"type": "NodePort", "ports": [{"port": 9090, "targetPort": 9090, "nodePort": 30001}]}}'
kubectl patch svc -n istio-system grafana -p '{"spec": {"type": "NodePort", "ports": [{"port": 3000, "targetPort": 3000, "nodePort": 30002}]}}'
kubectl patch svc -n istio-system kiali -p '{"spec": {"type": "NodePort", "ports": [{"port": 20001, "targetPort": 20001, "nodePort": 30003}]}}'
kubectl patch svc -n istio-system tracing -p '{"spec": {"type": "NodePort", "ports": [{"port": 80, "targetPort": 16686, "nodePort": 30004}]}}'

# Prometheus 접속 : envoy, istio 메트릭 확인
open http://127.0.0.1:30001

# Grafana 접속
open http://127.0.0.1:30002

# Kiali 접속 1 : NodePort
open http://127.0.0.1:30003

# (옵션) Kiali 접속 2 : Port forward
kubectl port-forward deployment/kiali -n istio-system 20001:20001 &
open http://127.0.0.1:20001

# tracing 접속 : 예거 트레이싱 대시보드
open http://127.0.0.1:30004


# 접속 테스트용 netshoot 파드 생성
cat <<EOF | kubectl apply -f -
apiVersion: v1
kind: Pod
metadata:
  name: netshoot
spec:
  containers:
  - name: netshoot
    image: nicolaka/netshoot
    command: ["tail"]
    args: ["-f", "/dev/null"]
  terminationGracePeriodSeconds: 0
EOF
6.1 Building resilience into the application
들어가며 : 복원력 패턴 필요
- 마이크로서비스는 복원력을 최우선으로 고려해 구축해야 한다.
- ‘장애가 발생하지 않도록 구축하면 된다’고 말하는 세상은 현실이 아니다. 장애가 발생하면 모든 서비스를 중단시킬 위험이 있다.
- 네트워크로 통신하는 서비스로 분산 시스템을 구축할 때는 장애 지점을 더 많이 많들어낼 위험이 있으며, 치명적인 장애가 발생할 가능성을 마주하게 된다.
- 따라서 서비스 소유자는 애플리케이션 및 서비스 전반에 걸쳐 몇 가지 복원력 패턴을 일관되게 채택해야 한다.
- 그림 6.1 처럼 서비스 A가 서비스 B를 호출했는데 서비스 B의 특정 엔드포인트로 전송이된 요청에서 지연이 발생했다면, 우리는 서비스 A가 이를 사전에 식별하고 다른 엔드포인트, 다른 가용 영역, 심지어 다른 리전으로 라우팅하길 원한다.
- 만약 서비스 B에 간간히 오류가 발생한다면 실패한 요청을 재시도할 수 있다.
- 마찬가지로 서비스 B를 호출하는 데 문제가 생긴다면, 그것이 무슨 문제든 서비스 B가 회복할 때까지 물러나야 할 수 있다.
- 계속 서비스 B로 부하를 가한다면(경우에 따라 요청을 재시도하면서 부하가 증폭되는 경우도 있음) 서비스를 과부하 상태로 만들 위험이 있다.
- 이런 과부하는 서비스 A와 이러한 서비스에 의존하는 모든 서비스에 파급돼 심각한 연쇄 오류를 일으킬 수 있다.
- 해결책은 애플리케이션이 장애를 예상해 요청을 처리할 때 자동으로 복원을 시도하거나 대체 경로로 돌아갈 수 있도록 구축하는 것이다.
- 예를 들어 서비스 A가 서비스 B를 호출할 때 문제가 발생한다면, 요청을 재시도하거나 타임아웃시키거나 서킷 브레이킹 패턴을 사용해 더 이상의 발신 요청을 취소할 수 있다.
- 이번 장에서는 애플리케이션의 프로그래밍 언어와 상관없이 애플리케이션에 복원력을 올바르고 일관되게 구현할 수 있도록, 이스티오를 사용해 이런 문제들을 투명하게 해결하는 방법을 살펴본다.
6.1.1 Building resilience into application libraries : 언어 마다 구현 상이, 운영 부담
- 서비스 메시 기술이 널리 사용되기 전까지 서비스 개발자인 우리가 애플리케이션 코드에 이런 복원력 패턴을 많이 작성해야 했다.
- 오픈소스 커뮤니티에서는 이런 문제를 해결하는 데 도움이 되는 몇 가지 프레임워크가 등장했다.
- 트위터는 2011년에 자사의 복원력 프레임워크 Finagle을 오픈소스화 했다.
- https://blog.x.com/engineering/en_us/a/2011/finagle-a-protocol-agnostic-rpc-system
- 트위터 Finagle은 ‘스칼라/자바/JVM’ 애플리케이션 라이브러리로 타임아웃, 재시도, 서킷 브레이킹 등 다양한 RPC 복원력 패턴을 구현하는 데 사용한다.
- 얼마 지나지 않아 넷플릭스는 자사의 복원력 프레임워크 구성 요소를 오픈소스화했다.
- 여기에는 Hystrix와 Ribbon이 포함되는데, 각기 서킷 브레이커와 클라이언트 측 로드 밸런싱 기능을 제공한다.https://netflixtechblog.com/announcing-ribbon-tying-the-netflix-mid-tier-services-together-a89346910a62
- https://netflixtechblog.com/introducing-hystrix-for-resilience-engineering-13531c1ab362
- 두 라이브러리 모두 자바 커뮤니티에서 매우 인기가 많았으며, 스프링 프레임워크는 NetfilxOSS 스택을 스프링 클라우드 프레임워크에 채택하기도 했다.
- https://spring.io/projects/spring-cloud-netflix
- 이런 프레임워크의 한 가지 문제점은 언어, 프레임워크, 인프라 조합마다 구현 방식이 상이하다는 것이다.
- 트위터 Finagle과 NetfilxOSS는 자바 개발자에게는 훌륭하지만 Node.js, Go 언어, 파이썬 개발자는 이런 패턴의 변형을 찾거나 직접 구현해야 했다.
- 때에 따라서는 이런 라이브러리가 애플리케이션 코드에 침입해 네트워킹 코드가 여거저기 흩어지고 실제 비즈니스 로직을 가려버리는 상황이 발생하기도 했다.
- 나아가 여러 언어와 프레임워크에 걸쳐 이런 라이브러리들을 유지 관리하는 것은 마이크로서비스 운영 측면에서 부담이 된다.
- 모든 조합을 동시에 패치하고 기능을 동일하게 유지해야 하기 때문이다.
6.1.2 Using Istio to solve these problems : 이스티오 서비스 프록시가 복원력 기능 제공
- 앞 장에서 봤듯이, 이스티오의 서비스 프록시는 애플리케이션 옆에 위치하며 애플리케이션을 드나드는 모든 네트워크 트래픽을 처리한다. (그림 6.2)
- 이스티오에서 서비스 프록시는 애플리케이션 수준 요청과 메시지(HTTP 요청 등)를 이해하므로 프록시 안에서 복원력 기능을 구현할 수 있다.

- 예를 들어 서비스 호출 시 HTTP 503 오류가 발생하면 세 번까지 재시도하도록 설정할 수 있다.
- 재시도할 실패, 재시도 횟수, 재시도별 타임아웃을 정확히 설정할 수 있는데, 서비스 프록시가 서비스 인스턴스마다 배포되므로 애플리케이션마다 필요한 대로 재시도 동작을 세밀하게 제어할 수 있다.
- 이스티오의 다른 복원력 설정도 모두 마찬가지다.
- 이스티오의 서비스 프록시는 기본적으로 다음과 같은 복원력 패턴을 구현한다.
- 클라이언트 측 로드 밸런싱 Client-side load balancing
- 지역 인식 로드 밸런싱 Locality-aware load balancing
- 타임아웃 및 재시도 Timeouts and retries
- 서킷 브레이킹 Circuit breaking
6.1.3 Decentralized implementation of resilience : 복원력 패턴을 분산 구현
- 이스티오를 사용하면, 애플리케이션 요청이 통과하는 데이터 플레인 프록시가 애플리케이션 인스턴스와 같은 위치에 있고 중앙집중식 게이트웨이가 필요하지 않음을 알 수 있다.
- 이런 복원력 패턴 처리를 코드에 함께 두는 애플리케이션 라이브러리를 사용하면 동일한 아키텍처를 얻는다.
- 예전에는 이런 분산 시스템의 공통 문제 중 일부를 해결하기 위해 비싸고 변경하기 어려운 중앙집중식 하드웨어 장치와 기타 소프트웨어 미들웨어를 요청 경로에 배치헀다. (하드웨어 로드 밸런싱, 메시징 시스템, 엔터프라이즈 서비스 버스, API 관리 등).
- 이런 초기 구현들은 더 정적인 환경에 맞춰 만들어져서, 고도로 동적이고 탄력적인 클라우드 아키텍처와 인프라에 맞게 확장되거나 잘 대응하지 못한다.
- 따라서 이런 일부 복원력 패턴을 해결할 때는 분산 구현을 선택해야 한다.
- 다음 절에서는 이스티오가 도움이 될 수 있는 복원력 패턴을 살펴볼 것이다.
- 서비스 작동 방식을 좀 더 세밀하게 제어하기 위해 다른 샘플 애플리케이션 셋을 사용하는데, 이 프로젝트는 좀 더 현실적인 운영 환경에서 서비스가 어떻게 작동할 수 있는지 설명하기 위해 만든 닉 잭슨 Nic Jackson의 Fake Service 라는 프로젝트다.
- https://github.com/nicholasjackson/fake-service
- 다음 예제에서는 그림 6.3과 같이 simple-web 서비스가 simple-backend 백엔드를 호출하는 것을 볼 수 있다.

6.2 Client-side load balancing 클라이언트 측 로드 밸런싱 (실습)
들어가며 : EDS, DestinationRule(Client LoadBalancer)
- 클라이언트 측 로드 밸런싱이란 엔드포인트 간에 요청을 최적으로 분산시키기 위해 클라이언트에게 서비스에서 사용할 수 있는 여러 엔드포인트를 알려주고 클라이언트가 특정 로드 밸런싱 알고리듬을 선택하게 하는 방식을 말한다.
- 이렇게 하면 병목 현상과 장애 지점을 만들 수 있는 중앙집중식 로드 밸런싱에 의존할 필요성이 줄어들고, 클라이언트가 군더더기 홉을 거칠 필요 없이 특정 엔드포인트로 직접적이면서 의도적으로 요청을 보낼 수 있다.
- 그러므로 클라이언트와 서비스는 더 잘 확장돼 변화하는 토폴로지에 대응할 수 있다.
- 이스티오는 서비스 및 엔드포인트 디스커버리를 사용해 그림 6.4처럼 서비스 간 통신의 클라이언트 측 프록시에 올바른 최신 정보를 제공한다.
- 그러면 서비스의 개발자와 운영자는 이스티오 설정으로 클라이언트 측 로드 밸런싱 동작을 설정할 수 있다.

- 서비스 운영자와 개발자는 DestinationRule 리소스로 클라이언트가 어떤 로드 밸런싱 알고리듬을 사용할지 설정할 수 있다.
- 이스티오의 서비스 프록시는 기반이 엔보이이므로 엔보이의 로드 밸런싱 알고리듬을 지원하며 그 중 일부는 다음과 같다.
- 라운드 로빈(기본값)
- 랜덤
- 가중치를 적용한 최소 요청
Server side load balancing vs. Client side load balancing 용어 정리와 비교(장/단점)
6.2.1 Getting started with client-side load balancing : DestinationRule 실습
실습 전 초기화
kubectl delete gw,vs,deploy,svc,destinationrule --all -n istioinaction예제 서비스 2개와 gw,vs 배포
# (옵션) kiali 에서 simple-backend-1,2 버전 확인을 위해서 labels 설정 : ch6/simple-backend.yaml
open ch6/simple-backend.yaml
...
apiVersion: apps/v1
kind: Deployment
metadata:
labels:
app: simple-backend
version: v1
name: simple-backend-1
spec:
replicas: 1
selector:
matchLabels:
app: simple-backend
template:
metadata:
labels:
app: simple-backend
version: v1
...
apiVersion: apps/v1
kind: Deployment
metadata:
labels:
app: simple-backend
version: v2
name: simple-backend-2
spec:
replicas: 2
selector:
matchLabels:
app: simple-backend
template:
metadata:
labels:
app: simple-backend
version: v2
...
# 예제 서비스 2개 배포
kubectl apply -f ch6/simple-backend.yaml -n istioinaction
kubectl apply -f ch6/simple-web.yaml -n istioinaction
# 확인
kubectl get deploy,pod,svc,ep -n istioinaction -o wide
NAME READY UP-TO-DATE AVAILABLE AGE CONTAINERS IMAGES SELECTOR
deployment.apps/simple-backend-1 1/1 1 1 105m simple-backend nicholasjackson/fake-service:v0.17.0 app=simple-backend
deployment.apps/simple-backend-2 2/2 2 2 105m simple-backend nicholasjackson/fake-service:v0.17.0 app=simple-backend
deployment.apps/simple-web 1/1 1 1 105m simple-web nicholasjackson/fake-service:v0.17.0 app=simple-web
...
# gw,vs 배포
cat ch6/simple-web-gateway.yaml
apiVersion: networking.istio.io/v1alpha3
kind: Gateway
metadata:
name: simple-web-gateway
spec:
selector:
istio: ingressgateway
servers:
- port:
number: 80
name: http
protocol: HTTP
hosts:
- "simple-web.istioinaction.io"
---
apiVersion: networking.istio.io/v1alpha3
kind: VirtualService
metadata:
name: simple-web-vs-for-gateway
spec:
hosts:
- "simple-web.istioinaction.io"
gateways:
- simple-web-gateway
http:
- route:
- destination:
host: simple-web
kubectl apply -f ch6/simple-web-gateway.yaml -n istioinaction
# 확인
kubectl get gw,vs -n istioinaction
docker exec -it myk8s-control-plane istioctl proxy-status
NAME CLUSTER CDS LDS EDS RDS ECDS ISTIOD VERSION
istio-ingressgateway-996bc6bb6-ztcx5.istio-system Kubernetes SYNCED SYNCED SYNCED SYNCED NOT SENT istiod-7df6ffc78d-xmjbj 1.17.8
simple-backend-1-7449cc5945-d9zmc.istioinaction Kubernetes SYNCED SYNCED SYNCED SYNCED NOT SENT istiod-7df6ffc78d-xmjbj 1.17.8
simple-backend-2-6876494bbf-vdttr.istioinaction Kubernetes SYNCED SYNCED SYNCED SYNCED NOT SENT istiod-7df6ffc78d-xmjbj 1.17.8
simple-backend-2-6876494bbf-zn6v9.istioinaction Kubernetes SYNCED SYNCED SYNCED SYNCED NOT SENT istiod-7df6ffc78d-xmjbj 1.17.8
simple-web-7cd856754-tjdv6.istioinaction Kubernetes SYNCED SYNCED SYNCED SYNCED NOT SENT istiod-7df6ffc78d-xmjbj 1.17.8
# 도메인 질의를 위한 임시 설정 : 실습 완료 후에는 삭제 해둘 것
echo "127.0.0.1 simple-web.istioinaction.io" | sudo tee -a /etc/hosts
cat /etc/hosts | tail -n 3
# 호출
curl -s http://simple-web.istioinaction.io:30000
open http://simple-web.istioinaction.io:30000
# 신규 터미널 : 반복 접속 실행 해두기
while true; do curl -s http://simple-web.istioinaction.io:30000 | jq ".upstream_calls[0].body" ; date "+%Y-%m-%d %H:%M:%S" ; sleep 1; echo; done
# 로그 확인
kubectl stern -l app=simple-web -n istioinaction
kubectl stern -l app=simple-web -n istioinaction -c istio-proxy
kubectl stern -l app=simple-web -n istioinaction -c simple-web
kubectl stern -l app=simple-backend -n istioinaction
kubectl stern -l app=simple-backend -n istioinaction -c istio-proxy
kubectl stern -l app=simple-backend -n istioinaction -c simple-backend
# (옵션) proxy-config
# proxy-config : simple-web
docker exec -it myk8s-control-plane istioctl proxy-config listener deploy/simple-web.istioinaction
docker exec -it myk8s-control-plane istioctl proxy-config routes deploy/simple-web.istioinaction
docker exec -it myk8s-control-plane istioctl proxy-config routes deploy/simple-web.istioinaction | grep backend
80 simple-backend, simple-backend.istioinaction + 1 more... /*
docker exec -it myk8s-control-plane istioctl proxy-config cluster deploy/simple-web.istioinaction --fqdn simple-backend.istioinaction.svc.cluster.local
SERVICE FQDN PORT SUBSET DIRECTION TYPE DESTINATION RULE
simple-backend.istioinaction.svc.cluster.local 80 - outbound EDS
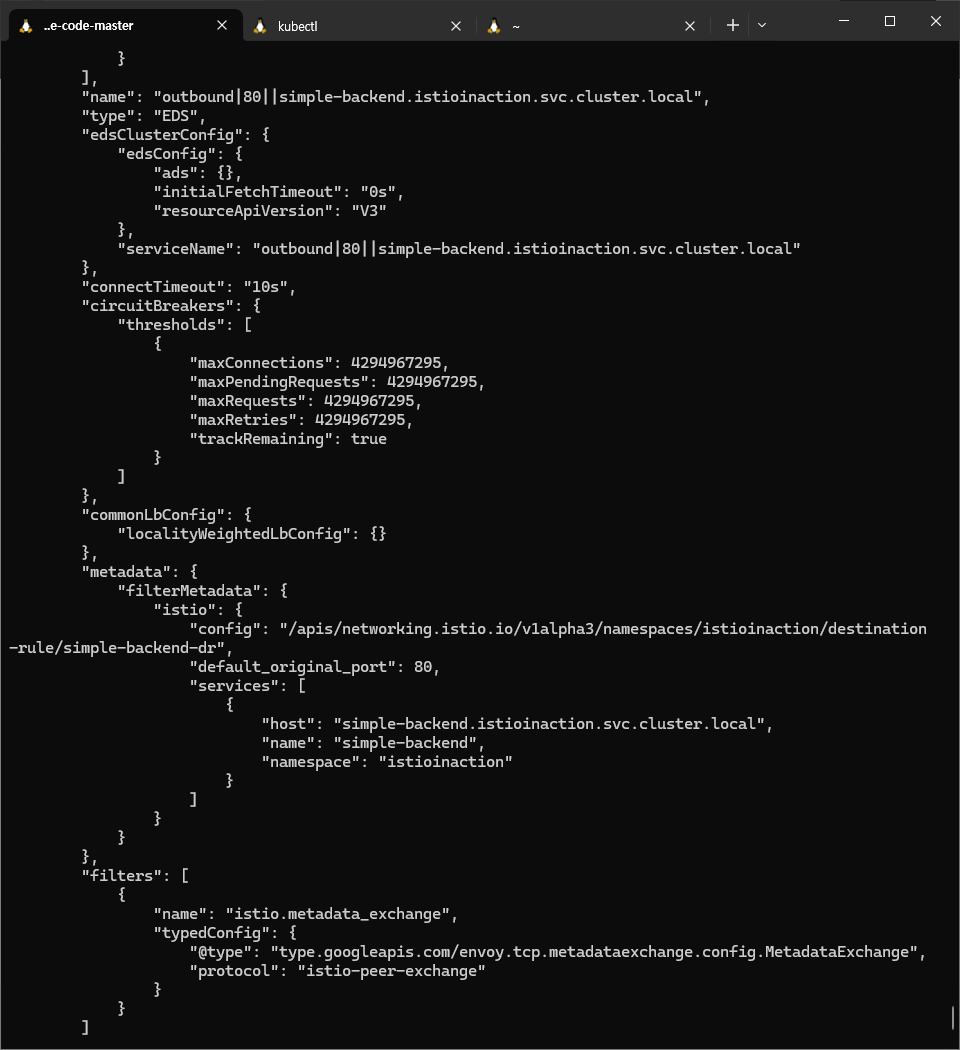
docker exec -it myk8s-control-plane istioctl proxy-config cluster deploy/simple-web.istioinaction --fqdn simple-backend.istioinaction.svc.cluster.local -o json
...
"name": "outbound|80||simple-backend.istioinaction.svc.cluster.local",
"type": "EDS",
"edsClusterConfig": {
"edsConfig": {
"ads": {},
"initialFetchTimeout": "0s",
"resourceApiVersion": "V3"
},
"serviceName": "outbound|80||simple-backend.istioinaction.svc.cluster.local"
},
"connectTimeout": "10s",
"lbPolicy": "LEAST_REQUEST",
...
docker exec -it myk8s-control-plane istioctl proxy-config endpoint deploy/simple-web.istioinaction
docker exec -it myk8s-control-plane istioctl proxy-config endpoint deploy/simple-web.istioinaction --cluster 'outbound|80||simple-backend.istioinaction.svc.cluster.local'
ENDPOINT STATUS OUTLIER CHECK CLUSTER
10.10.0.14:8080 HEALTHY OK outbound|80||simple-backend.istioinaction.svc.cluster.local
10.10.0.15:8080 HEALTHY OK outbound|80||simple-backend.istioinaction.svc.cluster.local
10.10.0.16:8080 HEALTHY OK outbound|80||simple-backend.istioinaction.svc.cluster.local
docker exec -it myk8s-control-plane istioctl proxy-config endpoint deploy/simple-web.istioinaction --cluster 'outbound|80||simple-backend.istioinaction.svc.cluster.local' -o json
...


- 이스티오 DestinationRule 리소스로 simple-backend 서비스를 호출하는 모든 클라이언트의 로드 밸런싱을 ROUND_ROBIN으로 설정하자.
- **DestinationRule**는 특정 목적지를 호출하는 메시 내 클라이언트들에 정책을 지정한다.
- simple-backend 용 첫 DestinationRule는 다음과 같다.
# cat ch6/simple-backend-dr-rr.yaml
apiVersion: networking.istio.io/v1beta1
kind: DestinationRule
metadata:
  name: simple-backend-dr
spec:
  host: simple-backend.istioinaction.svc.cluster.local
  trafficPolicy:
    loadBalancer:
simple: ROUND_ROBIN # 엔드포인트 결정을 '순서대로 돌아가며'- 적용 및 확인해보자
- simple-web 은 simple-backend 를 호출하는데, simple-backend 서비스에는 복제본이 여러게 있다.
- 이는 의도한 것으로, 런타임에 일부 엔드포인트를 수정해볼 것이다.
# DestinationRule 적용 : ROUND_ROBIN
cat ch6/simple-backend-dr-rr.yaml
kubectl apply -f ch6/simple-backend-dr-rr.yaml -n istioinaction
# 확인 : DestinationRule 단축어 dr
kubectl get dr -n istioinaction
NAME HOST AGE
simple-backend-dr simple-backend.istioinaction.svc.cluster.local 11s
kubectl get destinationrule simple-backend-dr -n istioinaction \
-o jsonpath='{.spec.trafficPolicy.loadBalancer.simple}{"\n"}'
ROUND_ROBIN
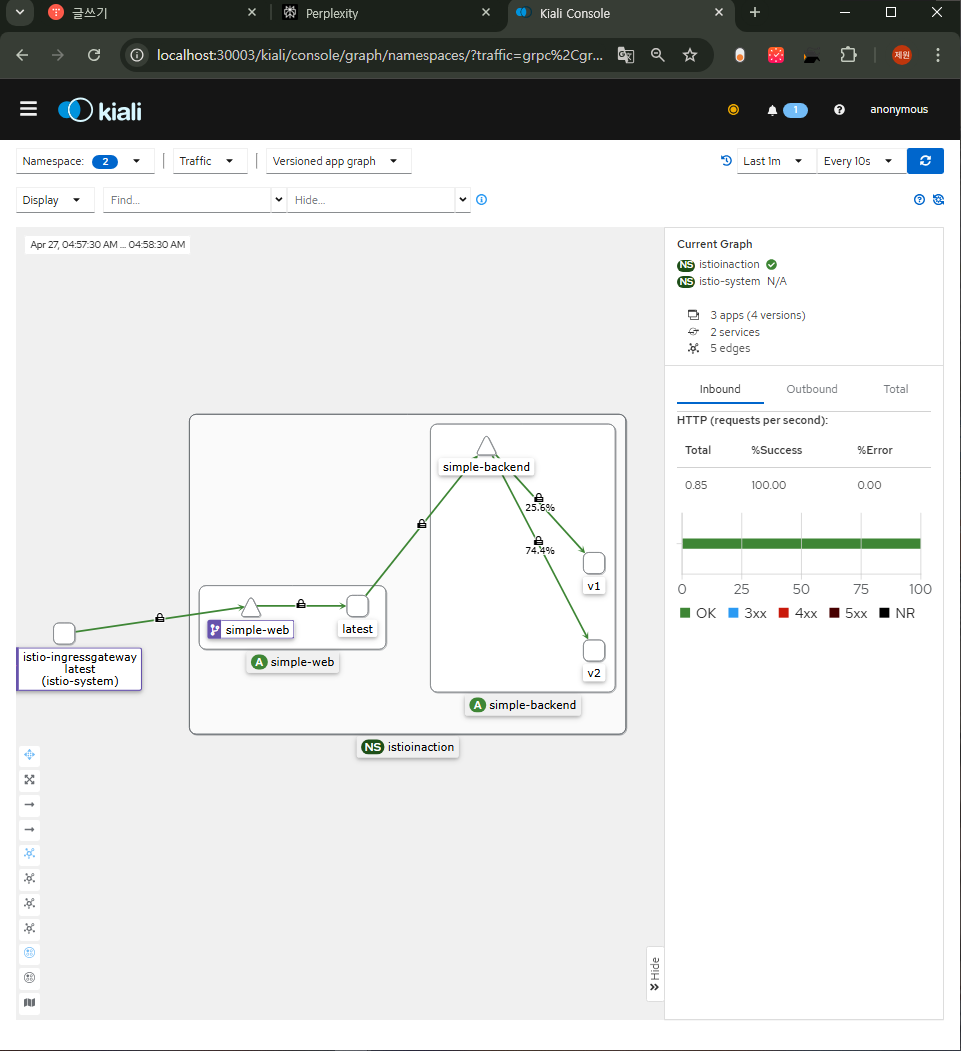
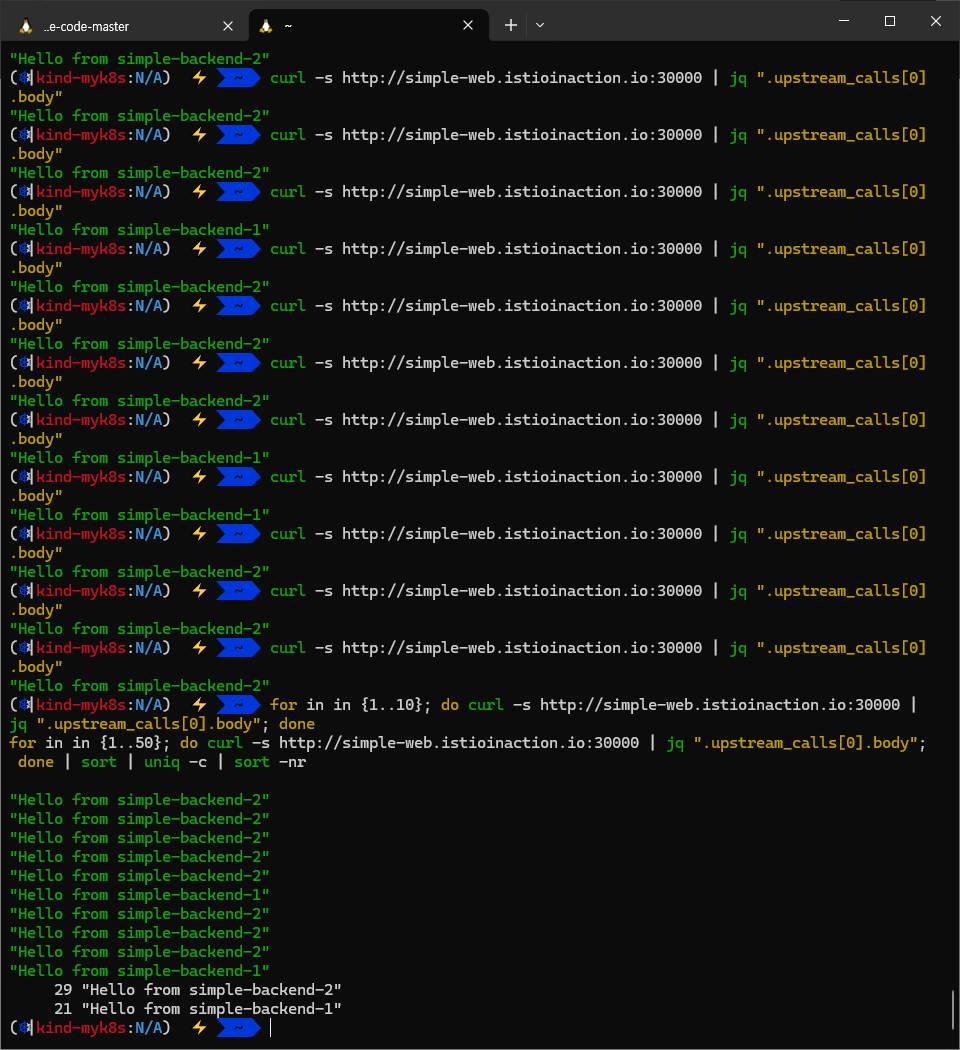
# 호출 : 이 예시 서비스 집합에서는 호출 체인을 보여주는 JSON 응답을 받느다
## simple-web 서비스는 simple-backend 서비스를 호출하고, 우리는 궁극적으로 simple-backend-1 에서 온 응답 메시지 Hello를 보게 된다.
## 몇 번 더 반복하면 simple-backend-1 과 simple-backend-2 에게 응답을 받는다.
curl -s http://simple-web.istioinaction.io:30000 | jq ".upstream_calls[0].body"
# 반복 호출 확인 : 파드 비중은 backend-2가 2개임
for in in {1..10}; do curl -s http://simple-web.istioinaction.io:30000 | jq ".upstream_calls[0].body"; done
for in in {1..50}; do curl -s http://simple-web.istioinaction.io:30000 | jq ".upstream_calls[0].body"; done | sort | uniq -c | sort -nr
# 로그 확인 : backend 요청을 하면 요청을 처리할 redirect 주소를 응답 (301), 전달 받은 redirect(endpoint)로 다시 요청
kubectl stern -l app=simple-web -n istioinaction -c istio-proxy
## simpleweb → simple-backend (301) redirect 응답 수신
simple-web-7cd856754-tjdv6 istio-proxy [2025-04-20T04:22:24.317Z] "GET // HTTP/1.1" 301 - via_upstream - "-" 0 36 3 3 "172.18.0.1" "curl/8.7.1" "ee707715-7e7c-42c3-a404-d3ee22f79d11" "simple-backend:80" "10.10.0.16:8080" outbound|80||simple-backend.istioinaction.svc.cluster.local 10.10.0.17:46590 10.200.1.161:80 172.18.0.1:0 - default
## simpleweb → simple-backend (200)
simple-web-7cd856754-tjdv6 istio-proxy [2025-04-20T04:22:24.324Z] "GET / HTTP/1.1" 200 - via_upstream - "-" 0 278 156 156 "172.18.0.1" "curl/8.7.1" "ee707715-7e7c-42c3-a404-d3ee22f79d11" "simple-backend:80" "10.10.0.14:8080" outbound|80||simple-backend.istioinaction.svc.cluster.local 10.10.0.17:38336 10.200.1.161:80 172.18.0.1:0 - default
## simpleweb → 외부 curl 응답(200)
simple-web-7cd856754-tjdv6 istio-proxy [2025-04-20T04:22:24.307Z] "GET / HTTP/1.1" 200 - via_upstream - "-" 0 889 177 177 "172.18.0.1" "curl/8.7.1" "ee707715-7e7c-42c3-a404-d3ee22f79d11" "simple-web.istioinaction.io:30000" "10.10.0.17:8080" inbound|8080|| 127.0.0.6:40981 10.10.0.17:8080 172.18.0.1:0 outbound_.80_._.simple-web.istioinaction.svc.cluster.local default
kubectl stern -l app=simple-backend -n istioinaction -c istio-proxy
## simple-backend → (응답) simpleweb (301)
simple-backend-2-6876494bbf-zn6v9 istio-proxy [2025-04-20T04:22:45.209Z] "GET // HTTP/1.1" 301 - via_upstream - "-" 0 36 3 3 "172.18.0.1" "curl/8.7.1" "71ba286a-a45f-41bc-9b57-69710ea576d7" "simple-backend:80" "10.10.0.14:8080" inbound|8080|| 127.0.0.6:54105 10.10.0.14:8080 172.18.0.1:0 outbound_.80_._.simple-backend.istioinaction.svc.cluster.local default
## simple-backend → (응답) simpleweb (200)
simple-backend-1-7449cc5945-d9zmc istio-proxy [2025-04-20T04:22:45.216Z] "GET / HTTP/1.1" 200 - via_upstream - "-" 0 278 152 152 "172.18.0.1" "curl/8.7.1" "71ba286a-a45f-41bc-9b57-69710ea576d7" "simple-backend:80" "10.10.0.15:8080" inbound|8080|| 127.0.0.6:43705 10.10.0.15:8080 172.18.0.1:0 outbound_.80_._.simple-backend.istioinaction.svc.cluster.local default
#
docker exec -it myk8s-control-plane istioctl proxy-config cluster deploy/simple-web.istioinaction --fqdn simple-backend.istioinaction.svc.cluster.local -o json
...
"name": "outbound|80||simple-backend.istioinaction.svc.cluster.local",
"type": "EDS",
"edsClusterConfig": {
"edsConfig": {
"ads": {},
"initialFetchTimeout": "0s",
"resourceApiVersion": "V3"
},
"serviceName": "outbound|80||simple-backend.istioinaction.svc.cluster.local"
},
"connectTimeout": "10s",
"lbPolicy": "LEAST_REQUEST", # RR은 기본값(?)이여서, 해당 부분 설정이 이전과 다르게 없다
...
#
docker exec -it myk8s-control-plane istioctl proxy-config endpoint deploy/simple-web.istioinaction --cluster 'outbound|80||simple-backend.istioinaction.svc.cluster.local' -o json


- simple-web 과 simple-backend 간 호출이 여러 simple-backend 엔드포인트로 효과적으로 분산되는 것을 확인할 수 있다.
- 우리는 simple-web 과 simple-backend 간의 클라이언트 측 로드 밸런싱을 보고 있는데, simple-web 과 함께 배포된 서비스 프록시가 모든 simple-backend 엔드포인트를 알고 있고 기본 알고리듬을 사용해 요청을 받을 엔드포인트를 결정하고 있기 때문이다.
- ROUND_ROBIN 로드 밸런싱을 사용하도록 DestinationRule 을 설정하기는 했지만, 사실 이스티오 서비스 프록시의 기본 설정도 ROUND_ROBIN 로드 밸런싱 전략을 사용하는 것이다.
- 클라이언트 측 로드 밸런싱은 어떻게 서비스의 복원력을 기여할 수 있을까?
- 부하 생성기를 사용해 simple-backend 서비스 지연 시간을 변화시키는 어느 정도 현실적인 시나리오를 살펴보자.
- 그러면 이런 상황에서 어떤 이스티오의 로드 밸런싱 전략이 가장 적합한지 선택하는 데 도움이 될 것이다.
6.2.2 Setting up our scenario : Fortio 설치
- 현실적인 환경에서 서비스가 요청을 처리하는 데 시간이 걸린다. 소요 시간은 여러 이유로 달라질 수 있다.
- 요청 크기 Request size
- 처리 복잡도 Processing complexity
- 데이터베이스 사용량 Database usage
- 시간이 걸리는 다른 서비스 호출 Calling other services that take time
- 서비스 외적인 이유도 응답 시간에 영향을 줄 수 있다.
- 예기치 못한, 모든 작업을 멈추는 stop-the-world 가비지 컬렉션 Unexpected, stop-the-world garbage collections
- 리소스 경합 Resource contention (CPU, 네트워크 등)
- 네트워크 혼잡 Network congestion
- 예제 서비스에서는 이를 모방하고자 응답 시간에 지연 delays 과 편차(변인) variance 를 도입해본다.
- 서비스를 다시 호출하고 최초 설정한 서비스 응답 시간의 차이를 관찰하자.
# 호출 3회 반복 : netshoot 에서 서비스명으로 내부 접속
kubectl exec -it netshoot -- time curl -s -o /dev/null http://simple-web.istioinaction
kubectl exec -it netshoot -- time curl -s -o /dev/null http://simple-web.istioinaction
kubectl exec -it netshoot -- time curl -s -o /dev/null http://simple-web.istioinaction
real    0m 0.17s
user    0m 0.00s
sys     0m 0.00s
...
- 서비스를 호출 할 때마다 응답 시간이 달라진다.
- 로드 밸런싱은 주기적으로 혹은 예기치 못하게 지연 시간이 급증하는 엔드포인트의 영향을 줄이는 효과적인 전략이 될 수 있다.
- 우리는 Fortio 라는 CLI 부하 생성 도구를 사용해 서비스를 실행하고 클라이언트 측 로드 밸런싱의 차이를 관찰할 것이다.
- Fortio load testing library, command line tool, advanced echo server and web UI in go (golang).
- Allows to specify a set query-per-second load and record latency histograms and other useful stats.
- https://github.com/fortio/fortio , 프리뷰 https://demo.fortio.org/
# mac 설치
brew install fortio
fortio -h
fortio server
open http://127.0.0.1:8080/fortio

# windows 설치
1. 다운로드 https://github.com/fortio/fortio/releases/download/v1.69.3/fortio_win_1.69.3.zip
2. 압축 풀기
3. Windows Command Prompt : fortio.exe server
4. Once fortio server is running, you can visit its web UI at http://localhost:8080/fortio/
Fortio 가 우리 서비스를 호출할 수 있는지 확인
fortio curl http://simple-web.istioinaction.io:30000
14:16:29.874 r1 [INF] scli.go:122> Starting, command="Φορτίο", version="1.69.3 h1:G1cy4S0/+JKwd1fuAX+1jKdWto4fPpxAdJHtHrWzF1w= go1.24.2 arm64 darwin", go-max-procs=8
HTTP/1.1 200 OK
...
윈도우와 wsl2 환경 사이에서 아마 좀 헷갈릴텐데 아래와 같은 방법을 사용하면 정상적으로 작동한다.
- 먼저 window 환경에서 fortio zip 파일 다운로드 받는다.
- zip 파일 압축 풀고 .\fortio server
6.2.3 Testing various client-side load-balancing strategies* : LB 알고리즘에 따란 지연 시간 성능 측정
테스트 환경
- 이제 Fortio 로드 테스트 클라이언트를 사용할 준비가 됐으므로 사용 사례를 살펴보자.
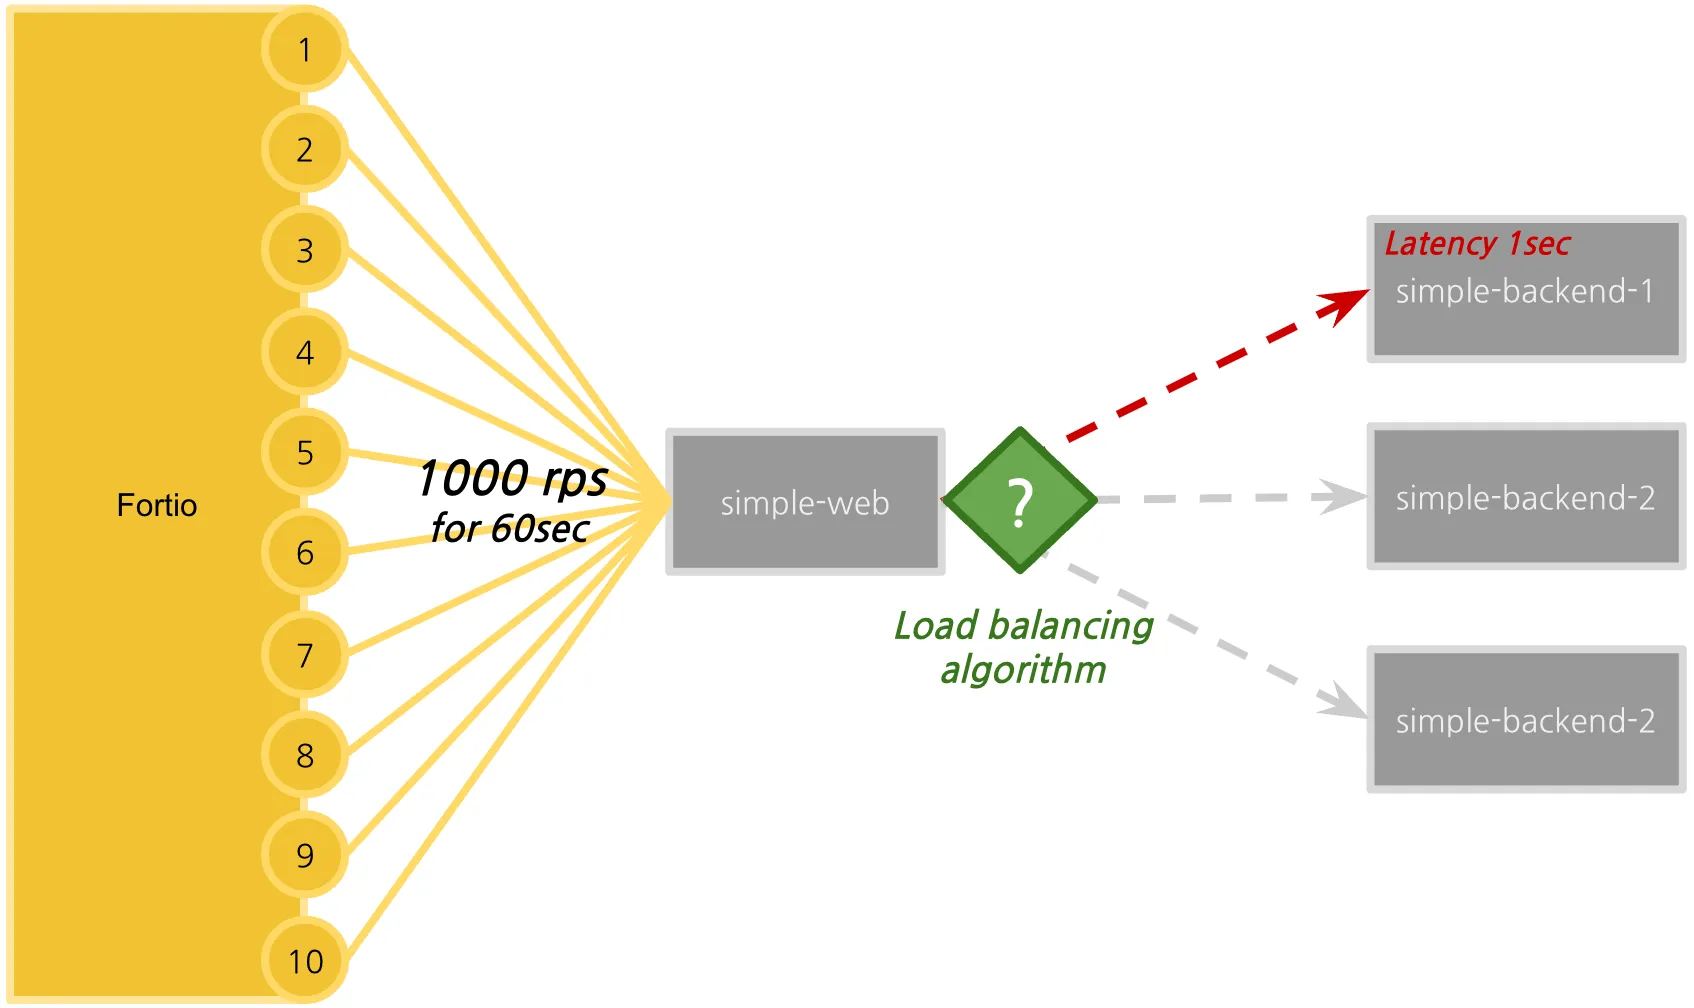
- Fortio를 사용해서 60초 동안 10개의 커넥션을 통해 초당 1000개의 요청을 보낼 것이다.
- Fortio to send 1,000 rps (requests per seconds) for 60 seconds through 10 connections
- Fortio는 각 호출의 지연 시간을 추적하고 지연 시간 백분위수 분석과 함께 히스토그램에 표시한다.
- 테스트를 하기 전에 지연 시간을 1초까지 늘린 simple-backend-1 서비스를 도입할 것이다.
- 이는 엔드포인트 중 하나에 긴 가비지 컬렉션 이벤트 또는 기타 애플리케이션 지연 시간이 발생한 상황을 시뮬레이션한다.
- 우리는 로드 밸런싱 전략을 라운드 로빈, 랜덤, 최소 커넥션으로 바꿔가면서 차이점을 관찰할 것이다.
지연된 simple-backend-1 서비스를 배포해보자 : fake-service - Dockerhub , Github
#
cat ch6/simple-backend-delayed.yaml
...
      - env:
        - name: "LISTEN_ADDR"
          value: "0.0.0.0:8080"
        - name: "SERVER_TYPE"
          value: "http"
        - name: "NAME"
          value: "simple-backend"
        - name: "MESSAGE"
          value: "Hello from simple-backend-1"
        - name: "TIMING_VARIANCE"
          value: "10ms"
        - name: "TIMING_50_PERCENTILE"
          value: "1000ms"
        - name: KUBERNETES_NAMESPACE
          valueFrom:
            fieldRef:
              fieldPath: metadata.namespace
        image: nicholasjackson/fake-service:v0.17.0
...
kubectl apply -f ch6/simple-backend-delayed.yaml -n istioinaction
kubectl rollout restart deployment -n istioinaction simple-backend-1

# 확인???
kubectl exec -it deploy/simple-backend-1 -n istioinaction -- env | grep TIMING
TIMING_VARIANCE=10ms
TIMING_50_PERCENTILE=150ms # ???

kubectl exec -it deploy/simple-backend-2 -n istioinaction -- env | grep TIMING
TIMING_VARIANCE=10ms
TIMING_50_PERCENTILE=150ms

# 직접 deploy 편집 수정???
KUBE_EDITOR="nano" kubectl edit deploy/simple-backend-1 -n istioinaction
...
      - name: TIMING_50_PERCENTILE
          value: 1000ms
...

kubectl rollout restart deployment -n istioinaction simple-backend-1
kubectl exec -it deploy/simple-backend-1 -n istioinaction -- env | grep TIMING
TIMING_VARIANCE=10ms
TIMING_50_PERCENTILE=150ms # ???


# 동작 중 파드에 env 직접 수정..
kubectl exec -it deploy/simple-backend-1 -n istioinaction -- sh
-----------------------------------
export TIMING_50_PERCENTILE=1000ms
exit
-----------------------------------

#
kubectl describe pod -n istioinaction -l app=simple-backend | grep TIMING_50_PERCENTILE:
      TIMING_50_PERCENTILE:  1000ms
      TIMING_50_PERCENTILE:  150ms
      TIMING_50_PERCENTILE:  150ms

# 테스트
curl -s http://simple-web.istioinaction.io:30000 | grep duration
curl -s http://simple-web.istioinaction.io:30000 | grep duration
curl -s http://simple-web.istioinaction.io:30000 | grep duration
  "duration": "1.058699s",
      "duration": "1.000934s",


?? 왜 되다 안되다 하는지는 모르겠으나 1s 가 찍혔으니 된다고 확인됨..
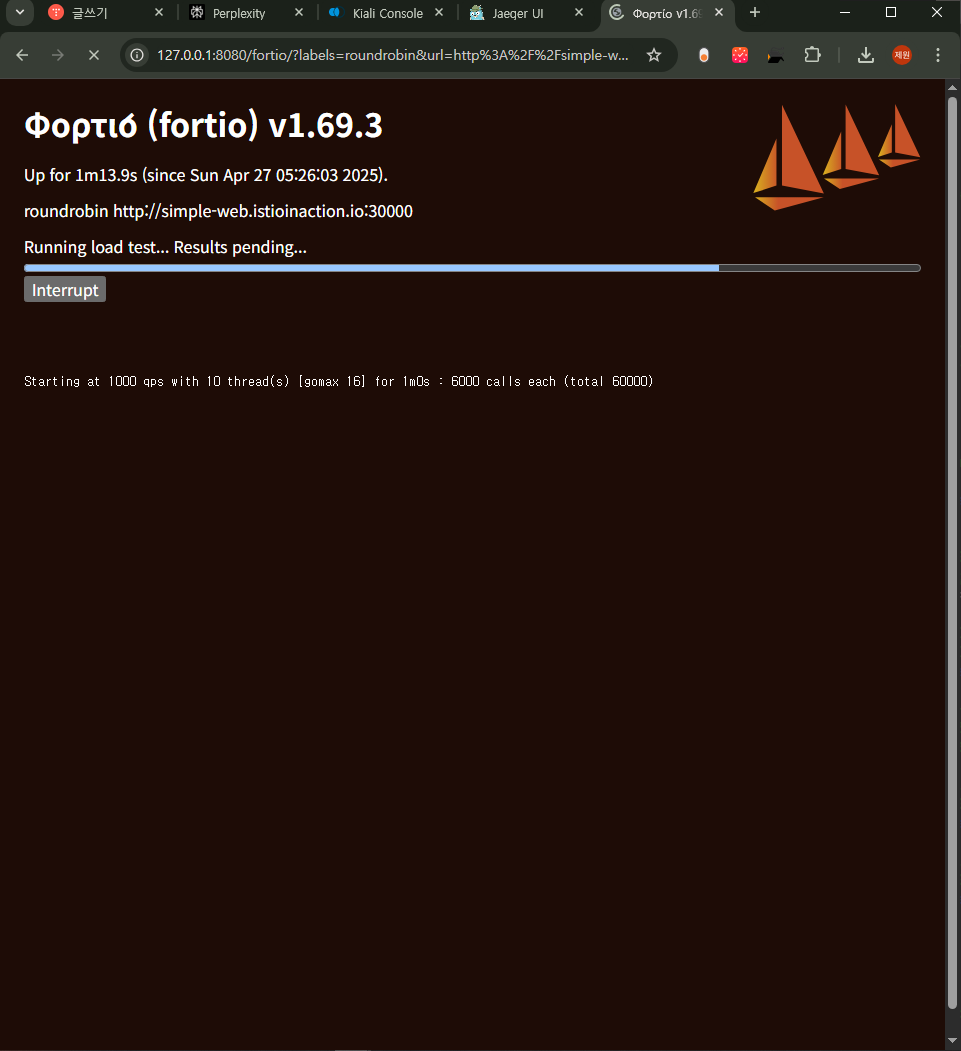

Fortio 를 서버 모드로 실행 후 웹 대시보드에 접근하자. fortio server
웹 대시보드에서는 테스트에 인자를 입력하고, 테스트를 실행하고, 결과를 시각화 할 수 있다. http://127.0.0.1:8080/fortio/
- Title : roundrobin
- URL : http://simple-web.istioinaction.io:30000
- QPS : 1000
- Duration : 60s
- Threads : 10
- Jitter: Check
- No Catch-up : Uncheck
- Extra Headers
- User-Agent: fortio
- Timeout : 2000ms
⇒ Start 클릭
테스트가 완료되면 결과 파일이 파일시스템이 저장된다. 또한 결과 그래프도 표시된다.
이 라운드 로빈 밸런싱 전략의 경우 지연 시간 결과 ⇒ 75분위수에서 응답이 1초 이상 걸림.
- target 50% 0.189584
- target 75% 1.03067
- target 90% 1.10307
- target 99% 1.14652
- target 99.9% 1.15086

로드 밸런싱 알고리듬을 RANDOM 으로 변경하고 다시 로드 테스트를 해보자
#
cat ch6/simple-backend-dr-random.yaml
apiVersion: networking.istio.io/v1beta1
kind: DestinationRule
metadata:
  name: simple-backend-dr
spec:
  host: simple-backend.istioinaction.svc.cluster.local
  trafficPolicy:
    loadBalancer:
      simple: RANDOM

kubectl apply -f ch6/simple-backend-dr-random.yaml -n istioinaction

# 확인
kubectl get destinationrule simple-backend-dr -n istioinaction \
 -o jsonpath='{.spec.trafficPolicy.loadBalancer.simple}{"\n"}'

#
docker exec -it myk8s-control-plane istioctl proxy-config cluster deploy/simple-web.istioinaction --fqdn simple-backend.istioinaction.svc.cluster.local -o json | grep lbPolicy
"lbPolicy": "RANDOM",
- fortio 동일하게 테스트 수행
- Title : random
- URL : http://simple-web.istioinaction.io:30000
- QPS : 1000
- Duration : 60s
- Threads : 10
- Jitter: Check
- No Catch-up : Uncheck
- Extra Headers
- User-Agent: fortio
- Timeout : 2000ms
- RANDOM 로드 밸런싱 알고리듬 지연 시간 결과 ⇒ ⇒ 75분위수에서 응답이 1초 이상 으로 RoundRobin 과 비슷함
# target 50% 0.19306
# target 75% 1.02324
# target 90% 1.05923
# target 99% 1.08082
# target 99.9% 1.08298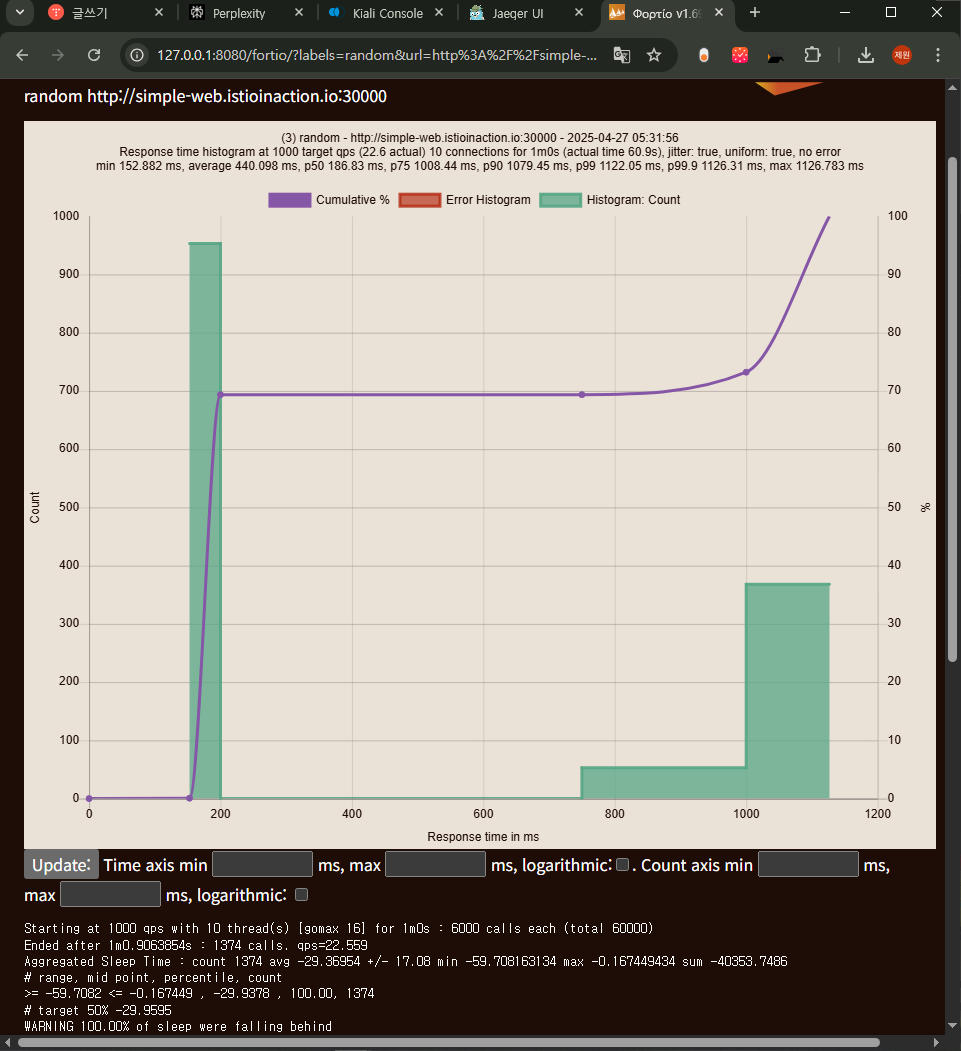

로드 밸런싱 알고리듬을 Least connection 으로 변경하고 다시 로드 테스트를 해보자
#
cat ch6/simple-backend-dr-least-conn.yaml
apiVersion: networking.istio.io/v1beta1
kind: DestinationRule
metadata:
  name: simple-backend-dr
spec:
  host: simple-backend.istioinaction.svc.cluster.local
  trafficPolicy:
    loadBalancer:
      simple: LEAST_CONN

kubectl apply -f ch6/simple-backend-dr-least-conn.yaml -n istioinaction

# 확인
kubectl get destinationrule simple-backend-dr -n istioinaction \
 -o jsonpath='{.spec.trafficPolicy.loadBalancer.simple}{"\n"}'

#
docker exec -it myk8s-control-plane istioctl proxy-config cluster deploy/simple-web.istioinaction --fqdn simple-backend.istioinaction.svc.cluster.local -o json | grep lbPolicy
"lbPolicy": "LEAST_REQUEST",
- fortio 동일하게 테스트 수행
- Title : least_conn
- URL : http://simple-web.istioinaction.io:30000
- QPS : 1000
- Duration : 60s
- Threads : 10
- Jitter: Check
- No Catch-up : Uncheck
- Extra Headers
- User-Agent: fortio
- Timeout : 2000ms
- Least connection로드 밸런싱 알고리듬 지연 시간 결과 ⇒ ⇒ 75분위수에서 응답이 200ms(0.19..) 이내 응답성능으로, RR, Random 보다 좋음!
# target 50% 0.183548
# target 75% 0.195571
# target 90% 1.00836
# target 99% 1.02942
# target 99.9% 1.03153실습 완료 후 Ctrl+C로 Fortio 서버를 종료하자.


6.2.4 Understanding the different load-balancing algorithms
- 로드 테스트 종합해보면,
- 첫째, 여러 로드 밸런서는 현실적인 서비스 지연 시간 동작하에서 만들어내는 결과가 서로 다르다.
- 둘째, 히스토그램과 백분위수는 모두 다르다.
- 마지막으로, 최소 커넥션이 랜덤과 라운드 로빈보다 성능이 좋다. 그 이유를 알아보자.
- 라운드 로빈과 랜덤 모두 간단한 로드 밸런싱 알고리듬이다. 따라서 구현하기도 이해하기도 쉽다.
- 라운드 로빈(또는 next-in-loop)은 엔드포인트에 차례대로 요청을 전달한다. 랜덤은 엔드포인트를 무작위로 균일하게 고른다.
- 둘 다 비슷한 분포를 기대할 수 있는데, 이 두 전략의 과제는 로드 밸런서 풀의 엔드포인트가 일반적으로 균일하지 않다는 것이다.
- 서비스의 리소스가 동일하더라도 그렇다.
- 테스트에서 시뮬레이션했던 것처럼, 엔드포인트에는 지연 시간을 늘리는 가비지 컬렉션이나 리소스 경합이 일어날 수 있고 라운드 로빈과 랜덤은 런타임 동작을 고려하지 않는다.
- 최소 커넥션 least-connection 로드 밸런서(엔보이에서는 최소 요청 least request으로 구현)는 특정 엔드포인트의 지연 시간을 고려한다.
- 요청을 엔드포인트로 보낼 때 대기열 깊이 queue depth 를 살펴 활성 요청 개수를 파악하고, 활성 요청이 가장 적은 엔드포인트를 고른다.
- 이런 알고리듬 유형을 사용하면, 형편없이 동작하는 엔드포인트로 요청을 보내는 것을 피하고 좀 더 빠르게 응답하는 엔드포인트를 선호할 수 있다.
엔보이 최소 요청 로드 밸런싱 Envoy least-request load balancing
- 이스티오 설정에서 최소 요청 로드 밸런싱 least-request load balancing 을 LEAST_CONN이라고 지칭하지만, 엔보이가 엔드포인트마다 파악하는 것은 요청 깊이지 커넥션이 아니다. Envoy is tracking request depths for endpoints, not connections.
- 로드 밸런서는 무작위 엔드포인트를 둘 고르고, 어떤 엔드포인트에 활성 요청이 더 적은지 확인하고, 더 적은 것을 고른다. The load balancer picks two random endpoints, checks which has the fewest active requests, and chooses the one with the fewest active requests.
- 연속적인 로드 밸런싱 시도에서도 마찬가지로 동작한다. It does the same thing for successive load-balancing tries
- 이런 방식을 ‘두 가지 선택의 힘(power of two choices)’ 이라고 한다. This is known as the power of two choices
- 로그 밸런서를 이렇게 구현하는 것이 전체를 확인하는 것에 비해 좋은 타협점이라고 알려져 있으며 좋은 결과를 보인다.
- 이 로드 밸런서에 대한 자세한 정보는 엔보이 문서를 참고하자. - Docs
6.3 Locality-aware load balancing 지역 인식 로드 밸런싱 (실습)
들어가며 : 배경 소개
- 이스티오 같은 컨트롤 플레인의 역할 중 하나는 서비스 토폴로지를 이해하고 그 토폴로지가 어떻게 발전할 수 있는지 파악하는 것이다.
- 서비스 메시에서 전체 서비스 토폴로지를 이해할 때의 이점은 서비스와 피어 서비스의 위치 같은 휴리스틱 heuristic 을 바탕으로 라우팅과 로드 밸런싱을 자동으로 결정할 수 있다는 점이다.

- 이스티오가 지원하는 로드 밸런싱 유형에는 워크로드의 위치에 따라 루트에 가중치를 부여하고 라우팅 결정을 내리는 것이다.
- 예를 들어 이스티오는 특정 서비스를 배포한 리전과 가용 영역을 식별하고, 더 가까운 서비스에 우선순위를 부여할 수 있다.
- 만약 simple-backend 서비스를 여러 리전에 배포했다면(us-west, us-east, europe-west), 호출하는 방법은 여러 가지가 있다.
- simple-web을 us-west 리전에 배포했다면, 우리는 simple-web이 하는 simple-backend 호출이 us-west 로컬이길 바랄 것이다. (그림 참고)
- 모든 엔드포인트를 동등하게 취급한다면 리전이나 영역을 넘나들면서 지연 시간이 길어지고 비용이 발생할 가능성이 크다.
6.3.1 Hands-on with locality load balancing*
- 지역 인식 로드 밸성싱이 잘 동작하는지 살펴보자. 쿠버네티스에 배포할 때, 리전과 영역 정보를 노드 레이블에 추가할 수 있다.
- 예를 들어 failure-domain.beta.kubernetes.io/region 레이블 및 failure-domain.beta.kubernetes.io/zone 은 각각 리전과 영역을 지정 할 수 있게 해준다.
- 최근에는 쿠버네티스 API 정식 버전에서는 이 레이블들을 topology.kubernetes.io/region 과 topology.kubernetes.io/zone 으로 대체했다.
- 이런 레이블은 구글 클라우드나 AWS 같은 클라우드 프로바이더가 자동으로 추가하는 경우가 많다.
- 이스티오는 이런 노드 레이블을 가져와 엔보이 로드 밸런싱 엔드포인트에 지역 정보로 보강한다.
- 현재 노드 1대(?)로 실습 하고 있으니, 다른 방식으로 지역 노드(?)로 실습을 하자.
- 이스티오에는 워크로드에 지역을 명시적으로 설정할 수 있는 방법이 있다.
- 파드에 istio-locality 라는 레이블을 달아 리전/영역을 지정할 수 있다.
- 이러면 지역 인식 라우팅 및 로드 밸런싱을 시연하기에 충분하다.
- 예를 들어 simple-web 디플로이먼트는 다음과 같을 수 있다.
# cat ch6/simple-service-locality.yaml
---
apiVersion: apps/v1
kind: Deployment
metadata:
  labels:
    app: simple-web
  name: simple-web
spec:
  replicas: 1
  selector:
    matchLabels:
      app: simple-web
  template:
    metadata:
      labels:
        app: simple-web
        istio-locality: us-west1.us-west1-a
...
---
apiVersion: apps/v1
kind: Deployment
metadata:
  labels:
    app: simple-backend
  name: simple-backend-1
spec:
  replicas: 1
  selector:
    matchLabels:
      app: simple-backend
  template:
    metadata:
      labels:
        app: simple-backend
        istio-locality: us-west1.us-west1-a
        version: v1 # 추가해두자!
...
---
apiVersion: apps/v1
kind: Deployment
metadata:
  labels:
    app: simple-backend
  name: simple-backend-2
spec:
  replicas: 2
  selector:
    matchLabels:
      app: simple-backend
  template:
    metadata:
      labels:
        app: simple-backend
        istio-locality: us-west1.us-west1-b
        version: v2 # 추가해두자!
...- simple-backend 서비스를 배포할 때 지역 레이블을 다양하게 지정할 것이다.
- simple-web과 같은 지역인 us-west1-a 에 simple-backend-1을 배포한다.
- 그리고 us-west1-b 에 simple-backend-2 를 배포한다. 이 경우, 리전은 동일하지만 영역이 다르다.
- 지역 간에 로드 밸런싱을 수행할 수 있는 이스티오의 기능에는 리전, 영역, 심지어는 더 세밀한 하위 영역 subzone 도 포함된다.
다음 서비스를 배포하자.
#
kubectl apply -f ch6/simple-service-locality.yaml -n istioinaction

# 확인
## simple-backend-1 : us-west1-a  (same locality as simple-web)
kubectl get deployment.apps/simple-backend-1 -n istioinaction \
-o jsonpath='{.spec.template.metadata.labels.istio-locality}{"\n"}'
us-west1.us-west1-a

## simple-backend-2 : us-west1-b
kubectl get deployment.apps/simple-backend-2 -n istioinaction \
-o jsonpath='{.spec.template.metadata.labels.istio-locality}{"\n"}'
us-west1.us-west1-b
- 이스티오의 지역 인식 로드 밸런싱은 기본적으로 활성화돼 있다. https://istio.io/v1.17/docs/reference/config/istio.mesh.v1alpha1/
- Locality aware load balancing is enabled by default
- 비활성화 하고 싶다면, meshConfig.localityLbSetting.enabled: false 로 설정하면 된다.
- 책 저자가 추천하는 이스티오의 지역 인식 로드 밸런싱 블로깅 https://karlstoney.com/locality-aware-routing/
- 앞서 시뮬레이션한 것치럼, 클러스터의 노드가 여러 가용성 영역에 배포돼 있다면 기본 지역 인식 로드 밸런싱이 항상 바람직하지는 않을 수도 있음을 고려해야 한다.
- 우리 예제에서는 어느 지역에서도 simple-backend(목표 서비스) 복제본이 simple-web(호출하는 서비스)보다 적지 않다.
- 그러나 실제 환경에서는 특정 지역에서 호출하는 서비스 인스턴스 보다 목표 서비스 인스턴스가 적게 배포될 수도 있다.
- 이런 경우 목표 서비스가 과부하를 겪을 수 있고, 시스템 전체의 부하가 의도한 것처럼 불균형하게 분산될 수 있다.
- 결국 부하 특성과 토폴로지에 맞춰 로드 밸런싱을 튜닝하는 것이 중요하다.
지역 정보가 준비되면, us-west1-a 에 있는 simple-web 호출이 같은 영역인 us-west1-a 에 배포된 simple-backend 서비스로 갈 것으로 기대할 수 있다.
- 우린 예제에서는 simple-web의 모든 트래픽이 us-west1-a 에 있는 simple-backend-1 로 향한다.
- simple-backend-2 서비스는 simple-web 과 다른 영역인 us-west-1b에 배포돼 있으므로, us-west1-a 에 있는 서비스가 실패하기 시작할 때만 simple-backend-2 로 향할 것으로 기대할 수 있다.
- 호출 테스트 1 ⇒ 지역 정보를 고려하지 않고 simple-backend 모든 엔드포인트로 트래픽이 로드 밸런싱 됨
# 신규 터미널 : 반복 접속 실행 해두기
while true; do curl -s http://simple-web.istioinaction.io:30000 | jq ".upstream_calls[0].body" ; date "+%Y-%m-%d %H:%M:%S" ; sleep 1; echo; done

# 호출 : 이 예시 서비스 집합에서는 호출 체인을 보여주는 JSON 응답을 받느다
curl -s http://simple-web.istioinaction.io:30000 | jq ".upstream_calls[0].body"

# 반복 호출 확인 : 파드 비중은 backend-2가 2개임
for in in {1..10}; do curl -s http://simple-web.istioinaction.io:30000 | jq ".upstream_calls[0].body"; done
for in in {1..50}; do curl -s http://simple-web.istioinaction.io:30000 | jq ".upstream_calls[0].body"; done | sort | uniq -c | sort -nr

- 이스티오에서 지역 인식 로드밸런싱이 작동하려면 헬스 체크를 설정해야 한다.
- 헬스 체크가 없으면 이스티오가 로드 밸런싱 풀의 어느 엔드포인트가 비정상 인지, 다음 지역으로 넘기는 판단 기준은 무엇인지를 알 수 없다.
- Istio does not know which endpoints in the load-balancing pool are unhealthy and what heuristics to use to spill over into the next locality.
- 이상값 감지는 엔드포인트의 동작과, 엔드포인트가 정상적으로 보이는지 여부를 수동적으로 감시한다.
- 엔드포인트가 오류를 반환하는지 지켜보다가, 오류가 반환되면 엔드포인트를 비정상으로 표시한다.
- 이상값 감지는 다음 절에서 더 자세히 다룬다.
simple-backend 서비스에 이상값 감지를 설정해 수동적인 헬스 체크 설정을 추가해보자.
#
cat ch6/simple-backend-dr-outlier.yaml
apiVersion: networking.istio.io/v1beta1
kind: DestinationRule
metadata:
  name: simple-backend-dr
spec:
  host: simple-backend.istioinaction.svc.cluster.local
  trafficPolicy:
    outlierDetection:
      consecutive5xxErrors: 1
      interval: 5s
      baseEjectionTime: 30s
      maxEjectionPercent: 100

kubectl apply -f ch6/simple-backend-dr-outlier.yaml -n istioinaction

# 확인
kubectl get dr -n istioinaction simple-backend-dr -o jsonpath='{.spec}' | jq


# 반복 호출 확인 : 파드 비중 확인
for in in {1..10}; do curl -s http://simple-web.istioinaction.io:30000 | jq ".upstream_calls[0].body"; done
for in in {1..50}; do curl -s http://simple-web.istioinaction.io:30000 | jq ".upstream_calls[0].body"; done | sort | uniq -c | sort -nr


# proxy-config : simple-web 에서 simple-backend 정보 확인
docker exec -it myk8s-control-plane istioctl proxy-config cluster deploy/simple-web.istioinaction --fqdn simple-backend.istioinaction.svc.cluster.local
docker exec -it myk8s-control-plane istioctl proxy-config cluster deploy/simple-web.istioinaction --fqdn simple-backend.istioinaction.svc.cluster.local -o json
...
        },
        "outlierDetection": {
            "consecutive5xx": 1,
            "interval": "5s",
            "baseEjectionTime": "30s",
            "maxEjectionPercent": 100,
            "enforcingConsecutive5xx": 100,
            "enforcingSuccessRate": 0
        },
...

docker exec -it myk8s-control-plane istioctl proxy-config endpoint deploy/simple-web.istioinaction --cluster 'outbound|80||simple-backend.istioinaction.svc.cluster.local'
docker exec -it myk8s-control-plane istioctl proxy-config endpoint deploy/simple-web.istioinaction --cluster 'outbound|80||simple-backend.istioinaction.svc.cluster.local' -o json
...
                "healthStatus": {
                    "edsHealthStatus": "HEALTHY"
                },
                "weight": 1,
                "priority": 1,
                "locality": {
                    "region": "us-west1",
                    "zone": "us-west1-b"
                }

...

# 로그 확인
kubectl logs -n istioinaction -l app=simple-backend -c istio-proxy -f
kubectl stern -l app=simple-backend -n istioinaction
...


모든 트래픽이 simple-web과 동일한 영역에 있는 simple-backend-1 서비스로 가고 있다.
- 호출 테스트 2 ⇒ 오동작 주입 후 확인
- 트래픽이 가용 영역을 넘어가는 것을 보기 위해 simple-backend-1 서비스를 오동작 상태로 만들어보자.
- simple-web 에서 simple-backend-1 호출하면 항상 HTTP 500 오류를 발생하게 하자
# HTTP 500 에러를 일정비율로 발생
cat ch6/simple-service-locality-failure.yaml
...
        - name: "ERROR_TYPE"
          value: "http_error"
        - name: "ERROR_RATE"
          value: "1"
        - name: "ERROR_CODE"
          value: "500"
...
kubectl apply -f ch6/simple-service-locality-failure.yaml -n istioinaction

# simple-backend-1- Pod 가 Running 상태로 완전히 배포된 후에 호출 확인

# 반복 호출 확인 : 파드 비중 확인
for in in {1..10}; do curl -s http://simple-web.istioinaction.io:30000 | jq ".upstream_calls[0].body"; done
for in in {1..50}; do curl -s http://simple-web.istioinaction.io:30000 | jq ".upstream_calls[0].body"; done | sort | uniq -c | sort -nr


# 확인
docker exec -it myk8s-control-plane istioctl proxy-config endpoint deploy/simple-web.istioinaction --cluster 'outbound|80||simple-backend.istioinaction.svc.cluster.local'
ENDPOINT            STATUS      OUTLIER CHECK     CLUSTER
10.10.0.23:8080     HEALTHY     OK                outbound|80||simple-backend.istioinaction.svc.cluster.local
10.10.0.24:8080     HEALTHY     OK                outbound|80||simple-backend.istioinaction.svc.cluster.local
10.10.0.25:8080     HEALTHY     FAILED            outbound|80||simple-backend.istioinaction.svc.cluster.local

# simple-backend-1 500에러 리턴으로 outliercheck 실패 상태로 호출에서 제외됨
docker exec -it myk8s-control-plane istioctl proxy-config endpoint deploy/simple-web.istioinaction --cluster 'outbound|80||simple-backend.istioinaction.svc.cluster.local' -o json
...
                "healthStatus": {
                    "failedOutlierCheck": true,
                    "edsHealthStatus": "HEALTHY"
                },
                ...
                "healthStatus": {
                    "edsHealthStatus": "HEALTHY"
                },
- 이렇게 특정 지역의 서비스가 제대로 동작하지 않을 때 예상하는 지역 인식 로드 밸런싱 결과를 얻을 수 있다.
- 이 지역 인식 로드 밸런싱은 단일 클러스터 내부에서 이뤄지는 것임을 유의하자
다음 실습을 위해 simple-backend-1 을 정상화
kubectl apply -f ch6/simple-service-locality.yaml -n istioinaction
6.3.2 More control over locality load balancing with weighted distribution : 가중치 분포로 지역 인식 LB 제어 강화
- 앞 절에서는 지역 인식 로드 밸런싱이 실제로 작동하는 모습을 살펴봤다.
- 지역 인식 로드밸런싱에서 마지막으로 알아둬야 하는 내용은 동작 방식 일부를 제어할 수 있다는 것이다.
- 이스티오의 기본 설정에서 서비스 프록시는 모든 트래픽을 동일 지역의 서비스로 보내고, 장애나 비정상 엔드포인트가 있을 때만 다른 지역으로 넘긴다.
- 하지만 트래픽 일부를 여러 지역에 분산하고 싶다면 이 동작에 영향을 줄 수 있는데, 이를 지역 가중 분포 locality weighted distribution 라고 한다.
- 특정 지역의 서비스가 피크 peak 시간이나 계절성 트래픽으로 인해 과부하될 것으로 예상될 경우 이런 방법을 사용할 수 있다.

- 특정 영역에서 리전이 처리 할 수 없는 부하가 들어온다고 해보자.
- 트래픽의 70%가 최인접 지역으로 가고, 30%가 인접 지역으로 가길 원한다.
- 앞선 예제를 따라 simple-backend 서비스로 가는 트래픽 70%를 us-west1-a로, 30%를 us-west1-b로 보낼 것이다.
실습해보자 : lb에 가중치 적용하기!
#
cat ch6/simple-backend-dr-outlier-locality.yaml
apiVersion: networking.istio.io/v1beta1
kind: DestinationRule
metadata:
name: simple-backend-dr
spec:
host: simple-backend.istioinaction.svc.cluster.local
trafficPolicy:
loadBalancer: # 로드 밸런서 설정 추가
localityLbSetting:
distribute:
- from: us-west1/us-west1-a/* # 출발지 영역
to:
"us-west1/us-west1-a/*": 70 # 목적지 영역
"us-west1/us-west1-b/*": 30 # 목적지 영역
connectionPool:
http:
http2MaxRequests: 10
maxRequestsPerConnection: 10
outlierDetection:
consecutive5xxErrors: 1
interval: 5s
baseEjectionTime: 30s
maxEjectionPercent: 100
kubectl apply -f ch6/simple-backend-dr-outlier-locality.yaml -n istioinaction
# 반복 호출 확인 : 파드 비중 확인
for in in {1..10}; do curl -s http://simple-web.istioinaction.io:30000 | jq ".upstream_calls[0].body"; done
for in in {1..50}; do curl -s http://simple-web.istioinaction.io:30000 | jq ".upstream_calls[0].body"; done | sort | uniq -c | sort -nr
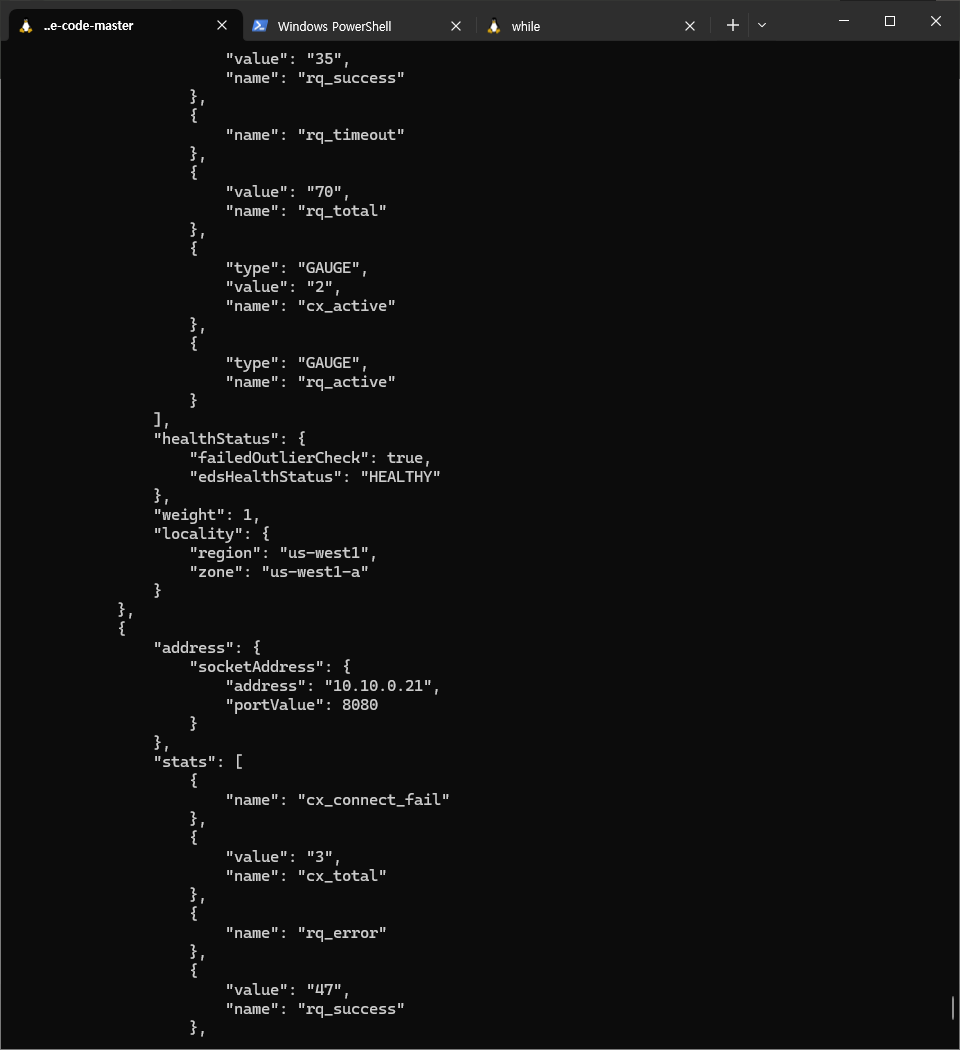
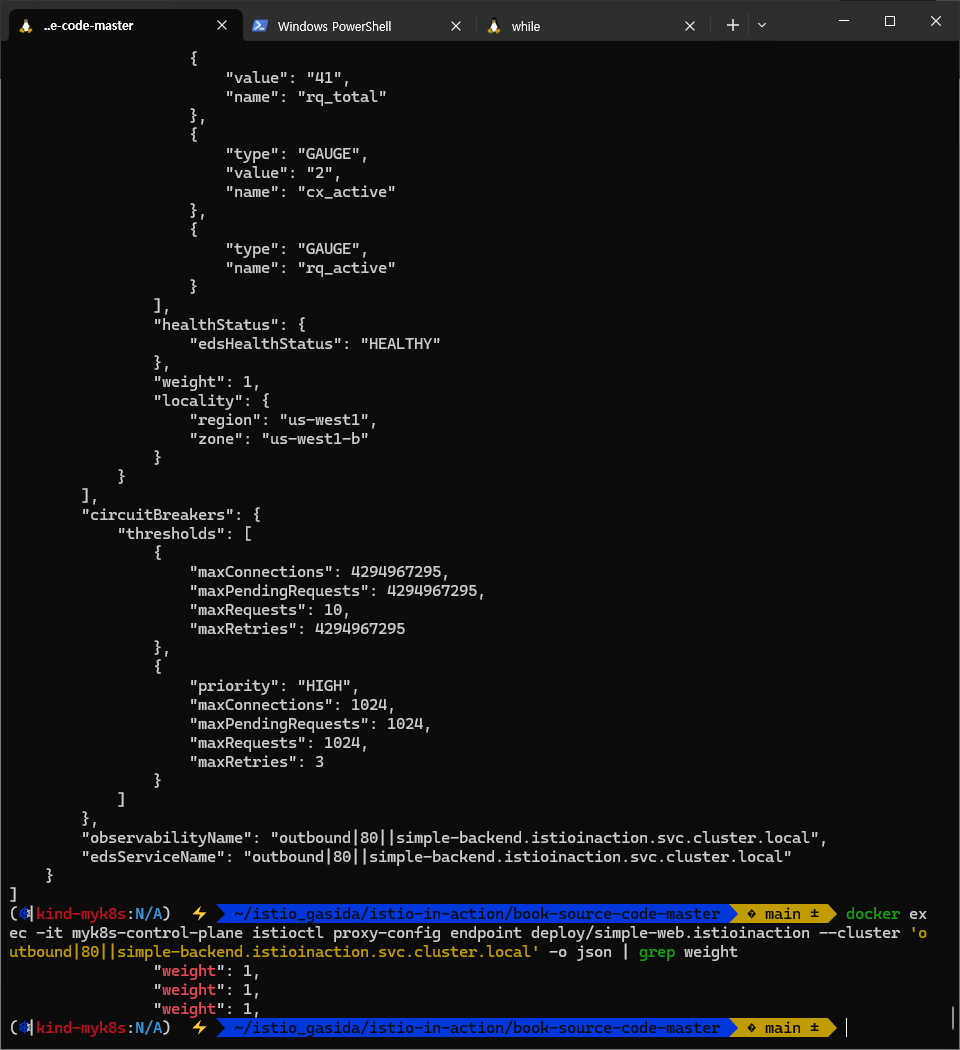
# endpoint 에 weight 는 모두 1이다. 위 70/30 비중은 어느곳의 envoy 에 설정 되는 걸까?...
docker exec -it myk8s-control-plane istioctl proxy-config endpoint deploy/simple-web.istioinaction --cluster 'outbound|80||simple-backend.istioinaction.svc.cluster.local' -o json
docker exec -it myk8s-control-plane istioctl proxy-config endpoint deploy/simple-web.istioinaction --cluster 'outbound|80||simple-backend.istioinaction.svc.cluster.local'
ENDPOINT STATUS OUTLIER CHECK CLUSTER
10.10.0.23:8080 HEALTHY OK outbound|80||simple-backend.istioinaction.svc.cluster.local
10.10.0.24:8080 HEALTHY OK outbound|80||simple-backend.istioinaction.svc.cluster.local
10.10.0.26:8080 HEALTHY OK outbound|80||simple-backend.istioinaction.svc.cluster.local

- 일부 요청이 분산됐다. 대부분은 가장 가까운 지역으로 향했지만, 다음 최인접 지역으로 넘어갈 수 있는 여지는 있었다.
- 이는 5장에서 트래픽을 명시적으로 제어했던 것과 동일하지 않다는 점에 유의하자.
- 트래픽 라우팅에서는 서비스의 부분집합 간에 트래픽 비중을 제어할 수 있었고, 보통 전체 서비스 그룹 내에서 종류나 버전이 여럿일 때 사용한다.
- 위 예제에서는 서비스의 배포 토폴로지를 바탕으로 트래픽에 가중치를 부여했고, 부분집합과는 무관한다.
- 부분집합 라우팅과 가중치 부여는 상호 배타적인 개념이 아니다.
- 이 둘은 중첩될 수 있으며, 5장에서 봤던 세밀한 트래픽 제어 및 라우팅을 이번 절에서 살펴본 지역 인식 로드 밸런서 위에 적용 할 수 있다.
6.4 Transparent timeouts and retries (실습)
들어가며 : 네트워크 신뢰성 문제 극복 필요
- 네트워크에 분산된 구성 요소에 의존하는 시스템을 구축할 때 가장 큰 문제는 지연 시간과 실패다.
- 앞선 절에서는 이스티오에서 로드 밸런싱과 지역을 사용해 이런 문제를 완화하는 방법을 살펴봤다.
- 이 네트워크 호출이 너무 길면 어떻게 되는가?
- 또는 지연 시간이나 다른 네트워크 요인 때문에 간간이 실패한다면?
- 이스티오는 이런 문제를 해결하는 데 어떻게 도움이 될 수 있을까?
- 이스티오를 사용하면 다양한 종류의 타임아웃과 재시도를 설정해 네트워크에 내재된 신뢰성 문제를 극복할 수 있다.
6.4.1 Timeouts : 지연 시간
- 분산 환경에서 가장 다루기 어려운 시나리오 중 하나가 지연 시간이다.
- 처리 속도가 느려지면 리소스를 오래 들고 있을 테고, 서비스에서는 처리해야 할 작업이 적체될 수 있으며, 상황은 연쇄 장애로까지 이어질 수 있다.
- 이런 예기치 못한 시나리오를 방지하려면 커넥션이나 요청, 혹은 둘 다에서 타임아웃을 구현해야 한다.
- 중요한 점은 서비스 호출 사이의 타임아웃이 서로 상호작용하는 방법이다.
- 예를 들어 서비스 A가 서비스 B를 호출할 때 타임아웃은 1초이지만 서비스 B가 서비스 C를 호출할 때 타임이웃은 2초라면, 어떤 타임아웃이 먼저 작동하는가?
- 가장 제한적인 타임아웃이 먼저 동작하므로, 서비스 B에서 서비스 C로의 타임아웃은 발동하지 않을 것이다.
- 일반적으로 아키텍처의 가장자리(트래픽이 들어오는 곳)에 가까울수록 타임아웃이 길고 호출 그래프의 계층이 깊을수록 타임아웃이 짧은(혹은 더 제한적인)것이 합리적이다.
- 통상, 밖 → 안, backend에 위치할 수록 timeout 을 짧게 설정합니다
- 어떻게 이스티오를 사용해 타임아웃 정책을 제어하는지 살펴보자.
환경을 재설정하자
kubectl apply -f ch6/simple-web.yaml -n istioinaction
kubectl apply -f ch6/simple-backend.yaml -n istioinaction
kubectl delete destinationrule simple-backend-dr -n istioinaction
호출 테스트 : simple-backend-1를 1초 delay로 응답
# 호출 테스트 : 보통 10~20ms 이내 걸림
curl -s http://simple-web.istioinaction.io:30000 | jq .code
time curl -s http://simple-web.istioinaction.io:30000 | jq .code
for in in {1..10}; do time curl -s http://simple-web.istioinaction.io:30000 | jq .code; done

# simple-backend-1를 1초 delay로 응답하도록 배포
cat ch6/simple-backend-delayed.yaml
kubectl apply -f ch6/simple-backend-delayed.yaml -n istioinaction

kubectl exec -it deploy/simple-backend-1 -n istioinaction -- env | grep TIMING
TIMING_VARIANCE=10ms
TIMING_50_PERCENTILE=150ms

# 동작 중 파드에 env 직접 수정..
kubectl exec -it deploy/simple-backend-1 -n istioinaction -- sh
-----------------------------------
export TIMING_50_PERCENTILE=1000ms
exit
-----------------------------------

# 호출 테스트 : simple-backend-1로 로드밸런싱 될 경우 1초 이상 소요 확인
for in in {1..10}; do time curl -s http://simple-web.istioinaction.io:30000 | jq .code; done
...
curl -s http://simple-web.istioinaction.io:30000  0.01s user 0.01s system 6% cpu 0.200 total
jq .code  0.00s user 0.00s system 3% cpu 0.199 total
500
...


- 1초 정도는 괜찮을 수 있지만, simple-backend의 지연 시간이 5초, 혹은 100초로 급증한다면 어떻게 될까?
- 이스티오를 사용해 simple-backend 서비스 호출에 타임아웃을 적용해보자.
- 이스티오는 VirtualService 리소스로 요청별로 타임아웃을 지정할 수 있다.
- 예를 들어 메시 내 클라이언트에서 simple-backend 로 향하는 호출의 타임아웃을 0.5초로 지정하려면 다음과 같이 하면 된다.
잘 작동 안되면 env 변경 후 rollout 필요
#
cat ch6/simple-backend-vs-timeout.yaml
apiVersion: networking.istio.io/v1alpha3
kind: VirtualService
metadata:
  name: simple-backend-vs
spec:
  hosts:
  - simple-backend
  http:
  - route:
    - destination:
        host: simple-backend
    timeout: 0.5s

kubectl apply -f ch6/simple-backend-vs-timeout.yaml -n istioinaction

#
kubectl get vs -n istioinaction
NAME                        GATEWAYS                 HOSTS                             AGE
simple-backend-vs                                    ["simple-backend"]                14s
simple-web-vs-for-gateway   ["simple-web-gateway"]   ["simple-web.istioinaction.io"]   6h11m


# 호출 테스트 : 0.5s 이상 걸리는 호출은 타임아웃 발생 (500응답)
for in in {1..10}; do time curl -s http://simple-web.istioinaction.io:30000 | jq .code; done
...
curl -s http://simple-web.istioinaction.io:30000  0.01s user 0.01s system 2% cpu 0.537 total
jq .code  0.00s user 0.00s system 0% cpu 0.535 total
500
...

# istio-proxy config 에서 위 timeout 적용 envoy 설정 부분 찾아 두자.

다음 절에서 타임아웃 같은 실패를 해결하기 위한 다른 방법을 논의한다.
6.4.2 Retries* : 재시도
설정 초기화
kubectl apply -f ch6/simple-web.yaml -n istioinaction
kubectl apply -f ch6/simple-backend.yaml -n istioinaction
- 서비스를 호출할 때 간간이 네트워크 실패를 겪는다면, 애플리케이션이 요청을 재시도하길 원할 수 있다.
- 요청을 재시도하지 않으면, 서비스가 흔히 발새하고 예견할 수 있는 실패에 취약해져 사용자에게 좋지 않은 경험을 제공할 수 있다.
- 한편으로 무분별한 재시도는 연쇄 장애를 야기하는 등 시스템 상태를 저하시킬 수 있으므로 적절히 균형을 맞춰야 한다.
- 서비스가 실제로 과부화된 경우에는 재시도해봐야 문제가 악화시킬 뿐이다.
- 이스티오의 재시도 옵션을 살펴보자.
- 이스티오에서는 재시도가 기본적으로 활성화돼 있고, 두 번까지 재시도한다.
- 동작을 세밀하게 튜닝하기에 앞서 기본 동작을 이해해야 한다.
- 시작하기 위해 예제 애플리케이션에서 기본적인 재시도를 비활성화하자.
- VirtualService 리소스에서 최대 재시도를 0으로 설정하면 된다.
#
docker exec -it myk8s-control-plane bash
----------------------------------------
# Retry 옵션 끄기 : 최대 재시도 0 설정
istioctl install --set profile=default --set meshConfig.defaultHttpRetryPolicy.attempts=0
y
exit
----------------------------------------

# 확인
kubectl get istiooperators -n istio-system -o yaml
...
    meshConfig:
      defaultConfig:
        proxyMetadata: {}
      defaultHttpRetryPolicy:
        attempts: 0
      enablePrometheusMerge: true
...

# istio-proxy 에서 적용 부분 찾아보자
에러 발생 시 재시도 실습
- 이제 주기적으로(75%) 실패하는 simple-backend 서비스 버전을 배포해보자.
- 이 경우 엔드포인트 셋 중 하나(simple-backend-1)는 그림 6.12처럼 호출 중 75%에 HTTP 503 반환한다.

#
cat ch6/simple-backend-periodic-failure-503.yaml
...
        - name: "ERROR_TYPE"
          value: "http_error"
        - name: "ERROR_RATE"
          value: "0.75"
        - name: "ERROR_CODE"
          value: "503"
...

#
kubectl apply -f ch6/simple-backend-periodic-failure-503.yaml -n istioinaction

#
kubectl exec -it deploy/simple-backend-1 -n istioinaction -- env | grep ERROR

#
kubectl exec -it deploy/simple-backend-1 -n istioinaction -- sh
---------------------------------------------------------------
export ERROR_TYPE=http_error
export ERROR_RATE=0.75
export ERROR_CODE=503
exit
---------------------------------------------------------------

# 호출테스트 : simple-backend-1 호출 시 failures (500) 발생
# simple-backend-1 --(503)--> simple-web --(500)--> curl(외부)
for in in {1..10}; do time curl -s http://simple-web.istioinaction.io:30000 | jq .code; done
...
curl -s http://simple-web.istioinaction.io:30000  0.01s user 0.01s system 6% cpu 0.200 total
jq .code  0.00s user 0.00s system 3% cpu 0.199 total
500
...

# app, istio-proxy log 에서 500, 503 로그 확인해보자.


- 기본적으로, 이스티오는 호출이 실패하면 두 번 더 시도한다. 이 기본 재시도는 특정 상황에서만 적용된다.
- 일반적으로는 이들 기본 상황에서는 재시도해도 안전한다.
- 이 상황들은 네트워크 커넥션이 수립되지 않아 첫 시도에서 요청이 전송될 수 없음을 의미하기 때문이다.
- 커넥션 수립 실패 connect-failure
- 스트림 거부됨 refused-stream
- 사용 불가 gRPC 상태 코드 14
- 취소됨 gRPC 상태 코드 1
- 재시도할 수 있는 상태 코드들 이스티오에서 기본값은 HTTP 503
- 우리는 앞서 살펴본 설정으로 기본 재시도 정책을 비활성화했다.
- 다음 VirtualService 리소스를 사용해 simple-backend 로 향하는 호출에 재시도를 2회로 명시적으로 설정해보자.
#
cat ch6/simple-backend-enable-retry.yaml
apiVersion: networking.istio.io/v1alpha3
kind: VirtualService
metadata:
  name: simple-backend-vs
spec:
  hosts:
  - simple-backend
  http:
  - route:
    - destination:
        host: simple-backend
    retries:
      attempts: 2

kubectl apply -f ch6/simple-backend-enable-retry.yaml -n istioinaction

#
docker exec -it myk8s-control-plane istioctl proxy-config routes deploy/simple-web.istioinaction --name 80
docker exec -it myk8s-control-plane istioctl proxy-config routes deploy/simple-web.istioinaction --name 80 -o json
...
               "name": "simple-backend.istioinaction.svc.cluster.local:80",
                "domains": [
                    "simple-backend.istioinaction.svc.cluster.local",
                    "simple-backend",
                    "simple-backend.istioinaction.svc",
                    "simple-backend.istioinaction",
                    "10.200.1.161"
                ],
                "routes": [
                    {
                        "match": {
                            "prefix": "/"
                        },
                        "route": {
                            "cluster": "outbound|80||simple-backend.istioinaction.svc.cluster.local",
                            "timeout": "0s",
                            "retryPolicy": {
                                "retryOn": "connect-failure,refused-stream,unavailable,cancelled,retriable-status-codes",
                                "numRetries": 2,
...

# 호출테스트 : 모두 성공!
# simple-backend-1 --(503, retry 후 정상 응답)--> simple-web --> curl(외부)
for in in {1..10}; do time curl -s http://simple-web.istioinaction.io:30000 | jq .code; done

# app, istio-proxy log 에서 503 로그 확인해보자.


- 앞에서 봤듯이, 실패는 있지만 호출자에게는 드러나지 않는다. 이스티오의 재시도 정책을 활성화해 이런 오류를 우회하게끔 했기 때문이다.
- HTTP 503은 기본적으로 재시도할 수 있는 상태 코드 중 하나다.
- 다음 VirtualService 재시도 정책은 설정할 수 있는 재시도 파라미터를 보여준다.
apiVersion: networking.istio.io/v1alpha3
kind: VirtualService
metadata:
  name: simple-backend-vs
spec:
  hosts:
  - simple-backend
  http:
  - route:
    - destination:
        host: simple-backend
    retries:
      attempts: 2 # 최대 재시도 횟수
      retryOn: gateway-error,connect-failure,retriable-4xx # 다시 시도해야 할 오류
      perTryTimeout: 300ms # 타임 아웃
retryRemoteLocalities: true # 재시도 시 다른 지역의 엔드포인트에 시도할지 여부- 다양한 재시도 설정으로 재시도 동작(얼마나 많이, 얼마나 깊게, 어느 엔드포인트로 재시도할 지)과 어떤 상태 코드일 때 재시도할지를 어느 정도 제어할 수 있다. 상술했듯이 모든 요청을 재시도할 수 있거나 해야 하는 것은 아니다.
- 예를 들어 HTTP 500 코드를 반환하는 simple-backend 서비스를 배포하면, 기본 재시도 동작은 실패를 잡아내지 않는다.
- 503 이외의 다른 에러 발생 시에도 retry 가 동작하는지 확인해보자.
# 500 에러 코드 리턴
cat ch6/simple-backend-periodic-failure-500.yaml
...
        - name: "ERROR_TYPE"
          value: "http_error"
        - name: "ERROR_RATE"
          value: "0.75"
        - name: "ERROR_CODE"
          value: "500"
...

kubectl apply -f ch6/simple-backend-periodic-failure-500.yaml -n istioinaction

#
kubectl exec -it deploy/simple-backend-1 -n istioinaction -- sh
---------------------------------------------------------------
export ERROR_TYPE=http_error
export ERROR_RATE=0.75
export ERROR_CODE=500
exit
---------------------------------------------------------------

# envoy 설정 확인 : 재시도 동작(retryOn) 에 retriableStatusCodes 는 503만 있음.
docker exec -it myk8s-control-plane istioctl proxy-config route deploy/simple-web.istioinaction --name 80 -o json
...
                       "route": {
                            "cluster": "outbound|80||simple-backend.istioinaction.svc.cluster.local",
                            "timeout": "0s",
                            "retryPolicy": {
                                "retryOn": "connect-failure,refused-stream,unavailable,cancelled,retriable-status-codes",
                                "numRetries": 2,
                                "retryHostPredicate": [
                                    {
                                        "name": "envoy.retry_host_predicates.previous_hosts",
                                        "typedConfig": {
                                            "@type": "type.googleapis.com/envoy.extensions.retry.host.previous_hosts.v3.PreviousHostsPredicate"
                                        }
                                    }
                                ],
                                "hostSelectionRetryMaxAttempts": "5",
                                "retriableStatusCodes": [
                                    503
                                ]
                            },
                            "maxGrpcTimeout": "0s"
                        },
...


# 호출테스트 : Retry 동작 안함.
# simple-backend-1 --(500, retry 안함)--> simple-web --(500)> curl(외부)
for in in {1..10}; do time curl -s http://simple-web.istioinaction.io:30000 | jq .code; done
...
curl -s http://simple-web.istioinaction.io:30000  0.01s user 0.01s system 30% cpu 0.036 total
jq .code  0.00s user 0.00s system 14% cpu 0.035 total
200
curl -s http://simple-web.istioinaction.io:30000  0.00s user 0.01s system 5% cpu 0.184 total
jq .code  0.00s user 0.00s system 2% cpu 0.183 total
500
...


- HTTP 500은 재시도하는 상태 코드에 포함되지 않는다.
- 모든 HTTP 500 코드(커넥션 수립 실패 및 스트림 거부 포함)를 재시도하는 VirtualService 재시도 정책을 사용해보자.
#
cat ch6/simple-backend-vs-retry-500.yaml
apiVersion: networking.istio.io/v1alpha3
kind: VirtualService
metadata:
  name: simple-backend-vs
spec:
  hosts:
  - simple-backend
  http:
  - route:
    - destination:
        host: simple-backend
    retries:
      attempts: 2
      retryOn: 5xx # HTTP 5xx 모두에 재시도

kubectl apply -f ch6/simple-backend-vs-retry-500.yaml -n istioinaction

# 호출테스트 : 모두 성공!
# simple-backend-1 --(500, retry)--> simple-web --(200)> curl(외부)
for in in {1..10}; do time curl -s http://simple-web.istioinaction.io:30000 | jq .code; done
- 사용할 수 있는 retryOn 설정은 엔보이 문서를 참조하자.
- https://www.envoyproxy.io/docs/envoy/latest/configuration/http/http_filters/router_filter#x-envoy-retry-on
타임아웃에 따른 재시도
- 각 재시도에는 자체적인 제한 시간(perTryTimeout) 이 있다.
- 이 설정에서 주의할 점은 perTryTimeout에 총 시도 횟수를 곱한 값이 전체 요청 제한 시간(이전 절에서 설명)보다 작아야 한다는 것이다.
- perTryTimeout * attempts < overall timeout
- 예를 들어, 총 제한 시간이 1초이고 시도별 제한 시간이 500ms에 3회까지 재시도하는 재시도 정책은 의도대로 동작하지 않는다.
- 재시도를 하기 전에 전체 요청 타임아웃이 발생할 것이다.
- 또 재시도 사이에는 백오프 backoff 지연이 있다는 점도 유념하자.
- perTryTimeout * attempts + backoffTime * (attempts-1) < overall timeout
- 이 백오프 시간도 전체 요청 제한 시간 계산에 포함된다.
- 백오프는 다음 절에서 더 자세히 다룬다.
작동 방식
- 요청이 이스티오 서비스를 서비스 프록시를 거쳐 흐를 때, 업스트림으로 전달되는 데 실패하면 요청을 ‘실패 failed’로 표시하고 VirtualService 리소스에 정의한 최대 재시도 횟수까지 재시도한다.
- 재시도 횟수가 2이면 실제로는 요청이 3회까지 전달되는데, 한 번은 원래 요청이고 두 번은 재시도다.
- 재시도 사이에 이스티오는 25ms 를 베이스로 재시도를 ‘백오프’ 한다.
- 재시도 및 백오프 동작을 설명하는 그림 6.13을 참조하자.

- 즉, 이스티오는 재시도에 시차를 주고자 연속적인 재시도에서 (25ms x 재시도 횟수)까지 백오프한다. (기다린다)
- 현재 재시도 베이스는 고정돼 있다.
- 그러나 다음 절에서 언급하겠지만, 이스티오가 노출하지 않는 엔보이는 API를 바꿀 수 있다.
- 상술했듯이 이스티오의 기본 재시도 횟수는 2회다.
- 시스템 내의 계층이 다르면 재시도 횟수도 다르도록 이 값을 재정의하고 싶을 수도 있다.
- 기본값과 같이 재시도 횟수를 무턱대고 설정하면, 심각한 재시도 ‘천둥 무리 thundering herd’ 문제가 발생할 수 있다. (그림 6.14 참조)

- 에를 들어 서비스 체인이 5단계 깊이로 연결돼 있고 각 단계가 두 번씩 재시도할 수 있다면, 들어오는 요청 하나에 대해 최대 32회의 요청이 발생할 수 있다.
- 체인 끝부분의 리소스에 과부하가 걸린 상태에서는 이 추가적인 부하가 해당 리소스를 감당할 수 없게 만들어 쓰러뜨릴수 있다.
- 이 상황을해결하는 한 가지 방법은 아키텍처 가장자리에서는 재시도 횟수를 1회 내지 0회로 제한하고, 중간 요소는 0회로 하며, 호출 스택 깊숙한 곳에서만 재시도하게 하는 것이다. 하지만 이 방법도 잘 작동하지는 않는다.
- 또 다른 전략은 전체 재시도 횟수에 상한을 두는 것이다.
- 재시도 예산 budget 를 이용해 조절할 수 있는데, 이 기능은 아직 이스티오 API에서 노출되지 않고 있다.
- 이스티오에 이런 문제에 대한 우회로가 있기는 하지만, 이 책의 범위를 벗어나는 내용이다.
- 마지막으로 재시도는 기본적으로 자기 지역의 엔드포인트에 시도한다. retryRemoteLocalities 설정은 이 동작에 영향을 준다.
- true로 설정하면, 이스티오는 재시도가 다른 지역으로 넘어갈 수 있도록 허용한다.
- 이상값 감지가 같은 지역의 엔드포인트가 오작동하고 있음을 알아내기 전에 이 설정이 유용할 수 있다.
6.4.3 Advanced retries : Istio Extension API (EnvoyFilter)
- 앞 절에서는 서비스가 간헐적인 네트워크 실패에 복원력을 갖추는 데 이스티오의 자동 재시도가 어떻게 도움이 되는지 살펴봤다.
- 재시도 동작을 조정할 수 있는 파라미터도 다뤘다.
- 재시도 기능 일부는 백오프 시간이나 재시도할 수 있는 상태 코드처럼 바꾸기 어려운 기본값들을 고려한다.
- 기본적으로 백오프 시간은 25ms이고, 재시도할 수 있는 상태 코드는 HTTP 503뿐이다.
- 이 책을 저술하는 시점에 이스티오 API가 이 설정을 노출하고 있지는 않지만, 이스티오 확장 API를 사용해 엔보이 설정에서 이 값들을 직접 바꿀수 있다.
- 이때에는 EnvoyFilter API를 사용한다.
# cat ch6/simple-backend-ef-retry-status-codes.yaml
apiVersion: networking.istio.io/v1alpha3
kind: EnvoyFilter
metadata:
  name: simple-backend-retry-status-codes
  namespace: istioinaction
spec:
  workloadSelector:
    labels:
      app: simple-web
  configPatches:
  - applyTo: HTTP_ROUTE
    match:
      context: SIDECAR_OUTBOUND
      routeConfiguration:
        vhost:
          name: "simple-backend.istioinaction.svc.cluster.local:80"
    patch:
      operation: MERGE
      value:
        route:
          retry_policy: # 엔보이 설정에서 직접 나온다?
            retry_back_off:
              base_interval: 50ms # 기본 간격을 늘린다
            retriable_status_codes: # 재시도할 수 있는 코드를 추가한다
            - 408
- 400- EnvoyFilter API는 ‘비상용(break glass)’ 해결책이다. 일반적으로 이스티오의 API는 기저 데이트 플레인에 대한 추상화다.
- 엔보이 API는 이스티오 릴리즈마다 바뀔 수 있으므로 반드시 운영 환경에 넣은 엔보이 필터가 유효한지 확인해야 하며, 하위 호환성을 전제하면 안된다.
- EnvoyFilter 리소스로 엔보이의 HTTP 필터를 설정하는 자세한 내용은 14장을 참조하자.
여기서는 엔보이 API를 직접 사용해 재시도 정책 설정값을 설정하고 재정의한다. 적용해보자.
# 408 에러코드를 발생
kubectl apply -f ch6/simple-backend-periodic-failure-408.yaml -n istioinaction

# 파드 정상 기동 후 수정
kubectl exec -it deploy/simple-backend-1 -n istioinaction -- sh
---------------------------------------------------------------
export ERROR_TYPE=http_error
export ERROR_RATE=0.75
export ERROR_CODE=408
exit
---------------------------------------------------------------

# 호출테스트 : 408 에러는 retryOn: 5xx 에 포함되지 않으므로 에러를 리턴.
# simple-backend-1 --(408)--> simple-web --(500)--> curl(외부)
for in in {1..10}; do time curl -s http://simple-web.istioinaction.io:30000 | jq .code; done
...
408 에러도 재시도 적용
#
cat ch6/simple-backend-ef-retry-status-codes.yaml
...
    patch:
      operation: MERGE
      value:
        route:
          retry_policy: # 엔보이 설정에서 직접 나온다?
            retry_back_off:
              base_interval: 50ms # 기본 간격을 늘린다
            retriable_status_codes: # 재시도할 수 있는 코드를 추가한다
            - 408
            - 400

kubectl apply -f ch6/simple-backend-ef-retry-status-codes.yaml -n istioinaction

# 확인
kubectl get envoyfilter -n istioinaction -o json
kubectl get envoyfilter -n istioinaction
NAME                                AGE
simple-backend-retry-status-codes   45s

# VirtualService 에도 재시도 할 대상 코드 추가
cat ch6/simple-backend-vs-retry-on.yaml
apiVersion: networking.istio.io/v1alpha3
kind: VirtualService
metadata:
  name: simple-backend-vs
spec:
  hosts:
  - simple-backend
  http:
  - route:
    - destination:
        host: simple-backend
    retries:
      attempts: 2
      retryOn: 5xx,retriable-status-codes # retryOn 항목에 retriable-status-codes 를 추가

kubectl apply -f ch6/simple-backend-vs-retry-on.yaml -n istioinaction

# envoy 설정 확인 : 재시도 동작(retryOn) 에 5xx 과 retriableStatusCodes 는 408,400 있음.
docker exec -it myk8s-control-plane istioctl proxy-config route deploy/simple-web.istioinaction --name 80 -o json
...
                        "route": {
                            "cluster": "outbound|80||simple-backend.istioinaction.svc.cluster.local",
                            "timeout": "0s",
                            "retryPolicy": {
                                "retryOn": "5xx,retriable-status-codes",
                                "numRetries": 2,
                                "retryHostPredicate": [
                                    {
                                        "name": "envoy.retry_host_predicates.previous_hosts",
                                        "typedConfig": {
                                            "@type": "type.googleapis.com/envoy.extensions.retry.host.previous_hosts.v3.PreviousHostsPredicate"
                                        }
                                    }
                                ],
                                "hostSelectionRetryMaxAttempts": "5",
                                "retriableStatusCodes": [
                                    408,
                                    400
                                ],
                                "retryBackOff": {
                                    "baseInterval": "0.050s"
                                }
                            },
                            "maxGrpcTimeout": "0s"
                        }
...

# 호출테스트 : 성공
# simple-backend-1 --(408, retry 성공)--> simple-web --> curl(외부)
for in in {1..10}; do time curl -s http://simple-web.istioinaction.io:30000 | jq .code; done
...


요청 헤징 REQUEST HEDGING
- 재시도에 대한 마지막 이야기는 이스티오 API에서도 직접 노출하지 않는 고급 주제를 중심으로 한다.
- 요청이 임계값에 도달해 시간을 초과하면 요청 헤징을 수행하도록 선택적으로 엔보이를 설정할 수 있다.
- 요청 헤징 request hedging 이란, 요청이 타임아웃되면 다른 호스트로도 요청을 보내 원래의 타임아웃된 요청과 ‘경쟁 race’ 시키는 것을 말한다.
- 경쟁한 요청이 성공적으로 반환되면, 그 응답을 원래 다운스트림 호출자에게 보낸다.
- 만약 경쟁한 요청보다 원본 요청이 먼저 반환되면 원본 요청이 다운스트림 호출자에게 반환된다.
- 요청 헤징을 설정하려면 다음 EnvoyFilter 리소스를 사용한다.
# cat ch6/simple-backend-ef-retry-hedge.yaml
apiVersion: networking.istio.io/v1alpha3
kind: EnvoyFilter
metadata:
  name: simple-backend-retry-hedge
  namespace: istioinaction
spec:
  workloadSelector:
    labels:
      app: simple-web
  configPatches:
  - applyTo: VIRTUAL_HOST
    match:
      context: SIDECAR_OUTBOUND
      routeConfiguration:
        vhost:
          name: "simple-backend.istioinaction.svc.cluster.local:80"
    patch:
      operation: MERGE
      value:
        hedge_policy:
          hedge_on_per_try_timeout: true
- 이번 절에서 봤듯이, 타임아웃과 재시도에 대한 주제는 그리 간단하지 않다.
- 서비스에 적절한 타임아웃 및 재시도 정책을 설정하는 것은 어려운 일이며, 둘이 어떻게 연결될 수 있을지를 고려하면 더욱 그렇다.
- 타임아웃과 재시도를 잘못 설정하면 시스템 아키텍처에서 의도치 않은 동작을 증폭시켜 시스템을 과부하시키고 연쇄 장애를 일으킬 수도 있다.
- 복원력 있는 아키텍처를 구축하는 과정에서 마지막 퍼즐 조작은 재시도를 모두 건너뛰는 것이다.
- 즉, 재시도하는 대신 빠르게 실패한다.
- 부하를 더 늘리는 대신에 업스트림 시스템이 복구될 수 있도록(회복 시간 벌기) 부하를 잠시 제한할 수 있으며, 이를 위해 서킷 브레이커를 사용할 수 있다.
6.5 Circuit breaking with Istio
들어가며 : 서킷 브레이커 소개
- 서킷 브레이커 기능을 사용하면 부분적이거나 연쇄적인 장애를 방지할 수 있다.
- 비정상 시스템을 계속 과부하시켜 회복을 방해하지 않도록 비정상 시스템으로 향하는 트래픽을 줄이고 싶다.
- 예를 들어 simple-web 서비스가 simple-backend 서비스를 호출하고 simple-backend 는 연속된 호출에서 오류를 반환하면, 계속 재시도해 시스템에 스트레스를 더 주는 대신 simple-backend로의 호출을 모두 멈추고 싶을 수 있다.
- 이 방식은 집의 전기 시스템에서 회로 차단기가 동작하는 방식과 의도가 비슷하다.
- 시스템에 단락이 있거나 고장이 반복되면, 회로 차단기는 회로를 개방해 나머지 시스템을 보호하도록 설계된다.
- 서킷 브레이커 패턴은 네트워크 호출이 실패할 수 있고 실제로 실패한다는 사실을 애플리케이션이 처리하게함으로써 전체 시스템을 연쇄 실패로부터 보호하는 데 도움이 된다.
- 이스티오에 ‘서킷 브레이커’라는 명시적인 설정은 없지만, 백엔드 서비스, 특히 문제가 있는 서비스로의 부하를 제한할 수 있는 방법이 두 가지 있어 서킷 브레이커를 효과적으로 시행할 수 있다.
- 첫 번째는 특정 서비스로의 커넥션 및 미해결 요청 개수를 얼마나 허용할지 관리하는 것이다. The first is to manage how many connections and outstanding requests are allowed to a specific service.
- 그림 6.15처럼 이 방법을 사용해 slow down 시켜서, 클라이언트를 적체시키는 서비스에 대비할 수 있다. We use this control to guard against services that slow down and thus back up the client, as illustrated in figure 6.15.

- 어떤 서비스에 진행 중인 요청이 10개이고 수신 부하가 동일한데 그 수가 계속 증가하고 있다면, 요청을 더 보내는 것은 의미가 없다.
- 요청을 더 보내면 업스트림 서비스가 압도 될 수 있다.
- 이스티오에서는 DestinationRule 의 connectionPool 설정을 사용해 서비스 호출 시 누적될 수 있는 커넥션 및 요청 개수를 제한할 수 있다.
- 요청이 너무 많이 쌓이면, 요청을 단락(빠르게 실패)시키고 클라이언트에 반환할 수 있다. If too many requests pile up, we can short-circuit them (fail fast) and return to the client.
- 두 번째 방법은 로드 밸런싱 풀의 엔드포인트에 상태를 관찰해 오동작하는 엔드포인트를 잠시 퇴출시키는 것이다.
- 서비스 풀의 특정 호스트에 문제가 발생하면 그 호스트로의 트래픽 전송을 건너뛸 수 있다.
- 모든 호스트를 소진하면 회로는 한동안 사실상 ‘개방’된다. If we exhaust all hosts, the circuit is effectively 'open' for a while.
- 이스티오로 이 서킷 브레이커 제어 각각을 어떻게 구현하는지 살펴보자.
6.5.1 Guarding against slow services wih connection-pool control* : 커넥션 풀 제어로 느린 서비스에 대응하기
(옵션) tracing 샘플링을 기본 1% → 100% 늘려두기
# tracing.sampling=100
docker exec -it myk8s-control-plane bash
----------------------------------------
istioctl install --set profile=default --set meshConfig.accessLogFile=/dev/stdout --set meshConfig.defaultConfig.tracing.sampling=100 --set meshConfig.defaultHttpRetryPolicy.attempts=0
y
exit
----------------------------------------

# 확인
kubectl describe cm -n istio-system istio
...
defaultConfig:
  discoveryAddress: istiod.istio-system.svc:15012
  proxyMetadata: {}
  tracing:
    sampling: 100.0
    zipkin:
      address: zipkin.istio-system:9411
...

# 적용 : rollout
kubectl rollout restart deploy -n istio-system istiod
kubectl rollout restart deploy -n istio-system istio-ingressgateway
kubectl rollout restart deploy -n istioinaction simple-web
kubectl rollout restart deploy -n istioinaction simple-backend-1
실습 환경 구성
# 현재 적용되어 있는 상태
kubectl apply -f ch6/simple-web.yaml -n istioinaction
kubectl apply -f ch6/simple-web-gateway.yaml -n istioinaction
kubectl apply -f ch6/simple-backend-vs-retry-on.yaml -n istioinaction

# destinationrule 삭제
kubectl delete destinationrule --all -n istioinaction

# simple-backend-2 제거
kubectl scale deploy simple-backend-2 --replicas=0 -n istioinaction

# 응답지연(1초)을 발생하는 simple-backend-1 배포
kubectl apply -f ch6/simple-backend-delayed.yaml -n istioinaction

# 동작 중 파드에 env 직접 수정..
kubectl exec -it deploy/simple-backend-1 -n istioinaction -- sh
-----------------------------------
export TIMING_50_PERCENTILE=1000ms
exit
-----------------------------------

# 테스트
curl -s http://simple-web.istioinaction.io:30000 | grep duration
  "duration": "1.058699s",
      "duration": "1.000934s",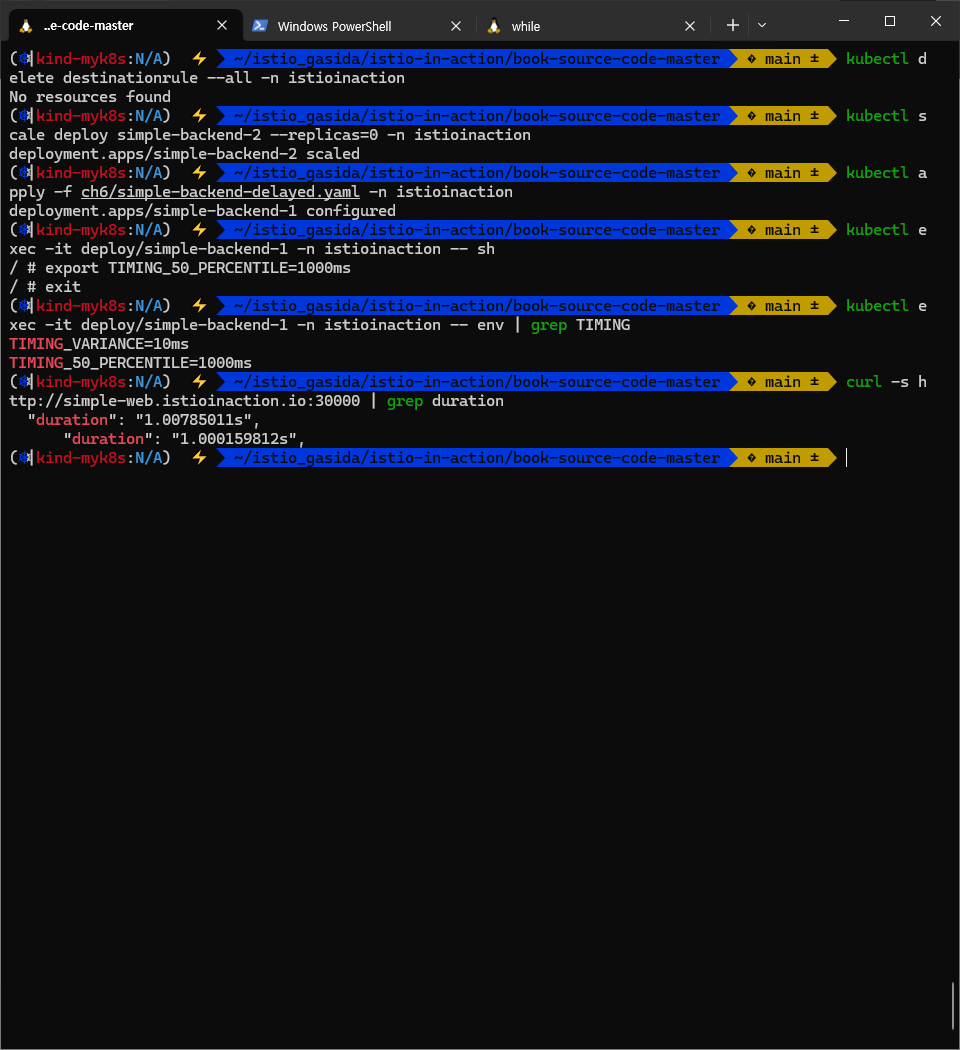
이스티오의 커넥션 제한 서킷 브레이커 테스트 시작해볼 수 있다. 아주 간단한 로드 테스트를 실행해보자.
# 초당 요청을 하나 보내는(-qps1) 커넥션 하나(-c1)로 진행 : 백엔드가 대략 1초 후 반환하므로 트래픽이 원활하고 성공률이 100%여야 한다.
fortio load -quiet -jitter -t 30s -c 1 -qps 1 http://simple-web.istioinaction.io:30000
...
# target 50% 1.02364
# target 75% 1.02788
# target 90% 1.03042
# target 99% 1.03195
# target 99.9% 1.0321
...
Code 200 : 30 (100.0 %)
All done 30 calls (plus 1 warmup) 1023.868 ms avg, 1.0 qps
- 커넥션 및 요청 제한을 도입하고 어떤 일이 일어나는지 살펴보자. 아주 간단한 제한으로 시작한다 - Docs
- maxConnections : 커넥션 총 개수, 커넥션 오버플로 connection overflow 를 보고할 임계값이다.
- 이스티오 프록시(엔보이)는 이 설정에 정의된 상한까지 서비스 요청에 커넥션을 사용한다.
- 실제 커넥션 최댓값은 로드 밸런싱 풀의 엔드포인트 개수에 설정값을 더한 숫자다.
- 이 값을 넘길 때마가 엔보이는 자신의 메트릭에 그 사실을 보고한다.
- Maximum number of HTTP1 /TCP connections to a destination host.
- http1MaxPendingRequests : 대기 중인 요청, 사용할 커넥션이 없어 보류 중인 요청을 얼마나 허용할지를 의미하는 숫자다.
- The allowable number of requests that are pending and don’t have a connection to use.
- Maximum number of requests that will be queued while waiting for a ready connection pool connection. Default 1024.
- http2MaxRequests : 모든 호스트에 대한 최대 동시 요청 개수, 안타깝게도 이 설정은 이스티오에서 이름을 잘못 붙였다.
- 내부적으로 이 숫자는 클러스터 내 모든 엔드포인트/호스트에 걸쳐 있는 병렬 요청의 최대 개수를 제어하는데, HTTP 2인지 HTTP 1.1인지는 상관없다. https://github.com/istio/istio/issues/27473
- This setting is unfortunately misnamed in Istio. Under the covers, it controls the maximum number of parallel requests across all endpoints/hosts in a cluster regardless of HTTP2 or HTTP1.1.
- Maximum number of active requests to a destination. Default 1024.
- maxConnections : 커넥션 총 개수, 커넥션 오버플로 connection overflow 를 보고할 임계값이다.
# cat ch6/simple-backend-dr-conn-limit.yaml
apiVersion: networking.istio.io/v1beta1
kind: DestinationRule
metadata:
  name: simple-backend-dr
spec:
  host: simple-backend.istioinaction.svc.cluster.local
  trafficPolicy:
    connectionPool:
      tcp:
        maxConnections: 1 # 커넥션 총 개수 Total number of connections
      http:
        http1MaxPendingRequests: 1 # 대기 중인 요청 Queued requests
        maxRequestsPerConnection: 1 # 커넥션당 요청 개수 Requests per connection
        maxRetries: 1 # Maximum number of retries that can be outstanding to all hosts in a cluster at a given time.
        http2MaxRequests: 1 # 모든 호스트에 대한 최대 동시 요청 개수 Maximum concurrent requests to all hosts

# DestinationRule 적용 (connection-limiting)
kubectl apply -f ch6/simple-backend-dr-conn-limit.yaml -n istioinaction
kubectl get dr -n istioinaction

#
docker exec -it myk8s-control-plane istioctl proxy-config cluster deploy/simple-backend-1.istioinaction | egrep 'RULE|backend'
SERVICE FQDN                                            PORT      SUBSET     DIRECTION     TYPE             DESTINATION RULE
                                                        8080      -          inbound       ORIGINAL_DST     simple-backend-dr.istioinaction
simple-backend.istioinaction.svc.cluster.local          80        -          outbound      EDS              simple-backend-dr.istioinaction

# 설정 적용 확인
docker exec -it myk8s-control-plane istioctl proxy-config cluster deploy/simple-backend-1.istioinaction --fqdn simple-backend.istioinaction.svc.cluster.local -o json
...
        "connectTimeout": "10s",
        "lbPolicy": "LEAST_REQUEST",
        "circuitBreakers": {
            "thresholds": [
                {
                    "maxConnections": 1, # tcp.maxConnections, 커넥션 총 개수 Total number of connections
                    "maxPendingRequests": 1, # http.http1MaxPendingRequests, 대기 중인 요청 Queued requests
                    "maxRequests": 1, # http.http2MaxRequests, 모든 호스트에 대한 최대 동시 요청 개수
                    "maxRetries": 1, # http.maxRetries
                    "trackRemaining": true
                }
            ]
        },
        "typedExtensionProtocolOptions": {
            "envoy.extensions.upstreams.http.v3.HttpProtocolOptions": {
                "@type": "type.googleapis.com/envoy.extensions.upstreams.http.v3.HttpProtocolOptions",
                "commonHttpProtocolOptions": {
                    "maxRequestsPerConnection": 1 # http.maxRequestsPerConnection, 커넥션당 요청 개수
...

# (참고) 기본값?
docker exec -it myk8s-control-plane istioctl proxy-config cluster deploy/istio-ingressgateway.istio-system --fqdn simple-web.istioinaction.svc.cluster.local -o json
...
        "connectTimeout": "10s",
        "lbPolicy": "LEAST_REQUEST",
        "circuitBreakers": {
            "thresholds": [
                {
                    "maxConnections": 4294967295,
                    "maxPendingRequests": 4294967295,
                    "maxRequests": 4294967295,
                    "maxRetries": 4294967295,
                    "trackRemaining": true
...

테스트를 다시 실행해 이 설정을 검증하다. 커넥션 하나에 초당 요청을 하나 보낼 때 제대로 동작해야 한다.
# 초당 요청을 하나 보내는(-qps1) 커넥션 하나(-c1)로 진행 :
fortio load -quiet -jitter -t 30s -c 1 -qps 1 --allow-initial-errors http://simple-web.istioinaction.io:30000
...
Sockets used: 1 (for perfect keepalive, would be 1)
Uniform: false, Jitter: true, Catchup allowed: false
Code 200 : 30 (100.0 %)
All done 30 calls (plus 1 warmup) 1023.648 ms avg, 1.0 qps
- 정확한 확인을 위해서 이스티오 서비스 프록시에서 더 많은 통계 수집을 활성화하자. ⇒ 서킷 브레이크 영향인지 vs 업스트림의 장애인지 확인
- 기본적으로 이스티오 서비스 프록시(엔보이)에는 각 클러스터에 대한 통계가 많지만 이스티오가 통계를 잘라낸다.
- 이는 수집 에이전트(프로메테우스 등)가 통계의 큰 카디널리티 cardinality 에 압도되지 않게 하기 위해서다.
- simple-web 서비스에 통계 수집을 활성화 해보자. simple-web 서비스는 simple-backend 서비스를 호출한다.
# simple-web 디플로이먼트에 sidecar.istio.io/statsInclusionPrefixes="cluster.<이름>" 애너테이션 추가하자
## sidecar.istio.io/statsInclusionPrefixes: cluster.outbound|80||simple-backend.istioinaction.svc.cluster.local
cat ch6/simple-web-stats-incl.yaml | grep statsInclusionPrefixes
        sidecar.istio.io/statsInclusionPrefixes: "cluster.outbound|80||simple-backend.istioinaction.svc.cluster.local"
kubectl apply -f ch6/simple-web-stats-incl.yaml -n istioinaction

# 정확한 확인을 위해 istio-proxy stats 카운터 초기화
kubectl exec -it deploy/simple-web -c istio-proxy -n istioinaction \
-- curl -X POST localhost:15000/reset_counters

# simple-web 에 istio-proxy 의 stats 조회
kubectl exec -it deploy/simple-web -c istio-proxy -n istioinaction \
 -- curl localhost:15000/stats | grep simple-backend | grep overflow
cluster.outbound|80||simple-backend.istioinaction.svc.cluster.local.upstream_cx_overflow: 0
cluster.outbound|80||simple-backend.istioinaction.svc.cluster.local.upstream_cx_pool_overflow: 0
cluster.outbound|80||simple-backend.istioinaction.svc.cluster.local.upstream_rq_pending_overflow: 0
cluster.outbound|80||simple-backend.istioinaction.svc.cluster.local.upstream_rq_retry_overflow: 0

kubectl exec -it deploy/simple-web -c istio-proxy -n istioinaction \
 -- curl localhost:15000/stats | grep simple-backend.istioinaction.svc.cluster.local.upstream
- Envoy 메트릭 ****- Docs
- upstream_cx_overflow : maxConnections 초과
- Total times that the cluster’s connection circuit breaker overflowed
- upstream_rq_pending_overflow : 대기 중인 요청 Queued requests, http1MaxPendingRequests 초과
- Total requests that overflowed connection pool or requests (mainly for HTTP/2 and above) circuit breaking and were failed.
- upstream_cx_overflow : maxConnections 초과
- 커넥션 개수와 초당 요청 수를 2로 늘리면 어떨까? 2개의 커넥션에서 요청을 초당 하나씩 보내기 시작해보자.
- 커넥션과 요청이 지정한 임계값(병렬 요청이 너무 많거나 요청이 너무 많이 쌓임)을 충분히 넘겨 서킷 브레이커를 동작시켰음을 확인.
# 2개의 커넥션에서 요청을 초당 하나씩 보내기 : 요청이 17개 실패한 것으로 반환됐다(HTTP 5xx)
fortio load -quiet -jitter -t 30s -c 2 -qps 2 --allow-initial-errors http://simple-web.istioinaction.io:30000
...
Sockets used: 19 (for perfect keepalive, would be 2)
Code 200 : 30 (63.8 %)
Code 500 : 17 (36.2 %)
All done 47 calls (plus 2 warmup) 925.635 ms avg, 1.5 qps
...

# 로그 확인 : simple-web
kubectl logs -n istioinaction -l app=simple-web -c istio-proxy -f
...
# 오류 요청 (503 Service Unavailable, UO 플래그
## HTTP 503: 서비스가 일시적으로 사용 불가능. Envoy가 업스트림 서버(simple-backend:80)에 요청을 전달하지 못함.
## UO 플래그: "Upstream Overflow"로, Envoy의 서킷 브레이커가 트리거되었거나 최대 연결/요청 제한에 도달했음을 의미.
## upstream_reset_before_response_started{overflow}: 업스트림 서버가 응답을 시작하기 전에 연결이 리셋되었으며, 이는 오버플로우(리소스 제한)로 인함.
[2025-04-22T03:17:24.830Z] "GET // HTTP/1.1" 503 UO upstream_reset_before_response_started{overflow} - "-" 0 81 4 - ...

# 오류 요청 (500 Internal Server Error) : 최종 사용자에게 500 에러 리턴
[2025-04-22T03:17:24.825Z] "GET / HTTP/1.1" 500 - via_upstream - "-" 0 687 11 11 ...
## simple-web 서비스에서 backend 정보를 가져오지 못하여 애플리케이션 레벨 오류 발생
## HTTP 500: 서버 내부 오류. 업스트림 서버(simple-web:30000)가 요청을 처리하는 중 예기치 않은 오류 발생.
## via_upstream: 오류가 Envoy가 아니라 업스트림 서버에서 발생했음을 나타냄.
...

# 통계 확인 : 18개로 +/- 1개 정도는 무시하고 보자. 성능 테스트 실패 갯수(17개)와 아래 통계값이 일치 한다(18-1).
# 큐 대기열이 늘어나 결국 서킷 브레이커를 발동함.
# fail-fast 동작은 이렇게 보류 중 혹은 병행 요청 갯수가 서킷 브레이커 임계값을 넘어 수행된다.
# The fail-fast behavior comes from those pending or parallel requests exceeding the circuit-breaking thresholds.
kubectl exec -it deploy/simple-web -c istio-proxy -n istioinaction \
 -- curl localhost:15000/stats | grep simple-backend | grep overflow
cluster.outbound|80||simple-backend.istioinaction.svc.cluster.local.upstream_cx_overflow: 45
cluster.outbound|80||simple-backend.istioinaction.svc.cluster.local.upstream_cx_pool_overflow: 0
cluster.outbound|80||simple-backend.istioinaction.svc.cluster.local.upstream_rq_pending_overflow: 18
cluster.outbound|80||simple-backend.istioinaction.svc.cluster.local.upstream_rq_retry_overflow: 0

kubectl exec -it deploy/simple-web -c istio-proxy -n istioinaction \
 -- curl localhost:15000/stats | grep simple-backend.istioinaction.svc.cluster.local.upstream


- 503 UO (Upstream Overflow) : Envoy가 업스트림 서버로의 요청을 처리할 수 없어 오버플로우 발생 - 최대 연결/요청 제한 or 서킷 브레이커
- 요청을 처리하려 했으나, Envoy 내부의 버퍼나 큐(예: 연결 풀, 요청 큐 등)가 가득 차서 더 이상 업스트림으로 요청을 전달할 수 없는 상태
- 업스트림 서버가 느리게 응답하거나, 다운됨
- 트래픽 급증으로 인해 큐에 쌓인 요청이 너무 많음
- Envoy의 circuit breaker 설정 (예: max_requests, max_connections)을 초과함
- 요청을 처리하려 했으나, Envoy 내부의 버퍼나 큐(예: 연결 풀, 요청 큐 등)가 가득 차서 더 이상 업스트림으로 요청을 전달할 수 없는 상태
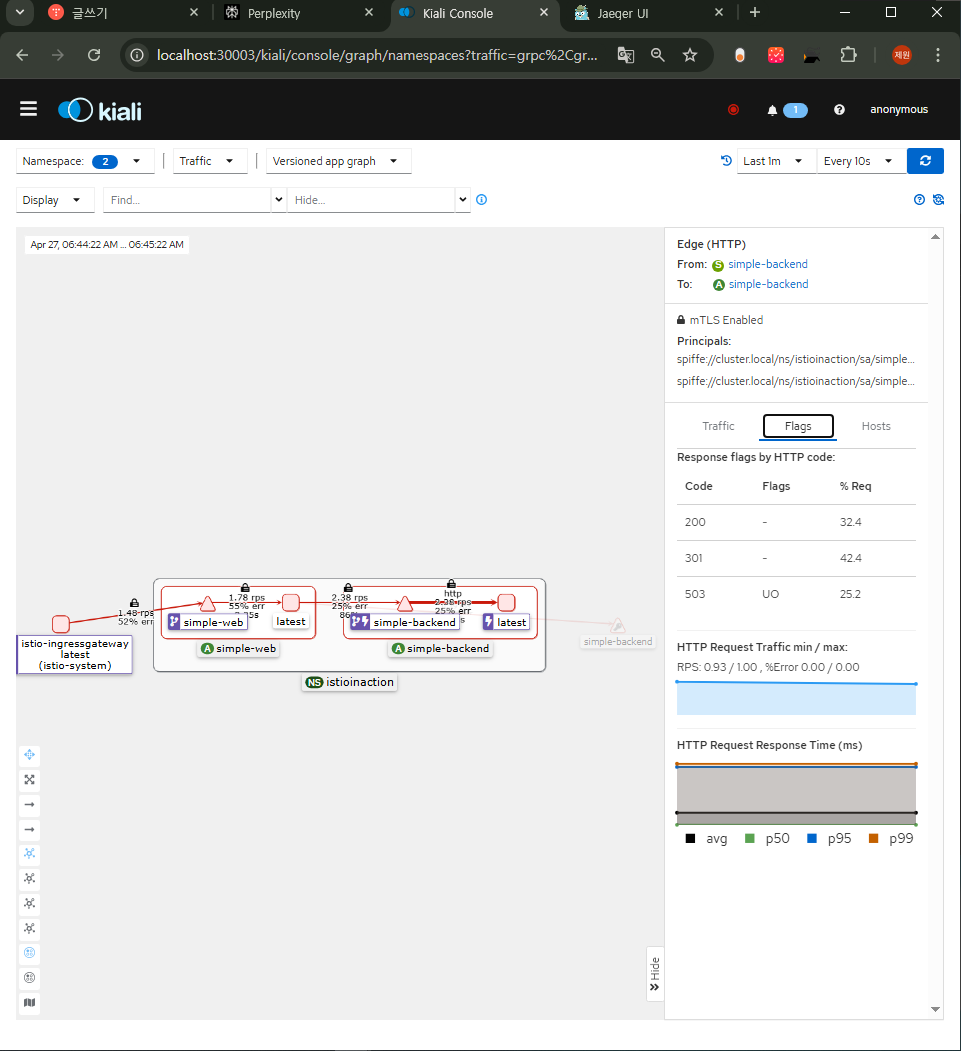

Jaeger 확인 : 실패 trace 확인 - simple-backend istio-proxy 가 UO 로 503을 리턴하고 → simple-web은 500을 사용자에게 최종 리턴함
jaeger 에서 Tags 필터링 찾기 : error=true

프로메테우스 메트릭 링크 envoy_cluster_upstream_cx_overflow - Link
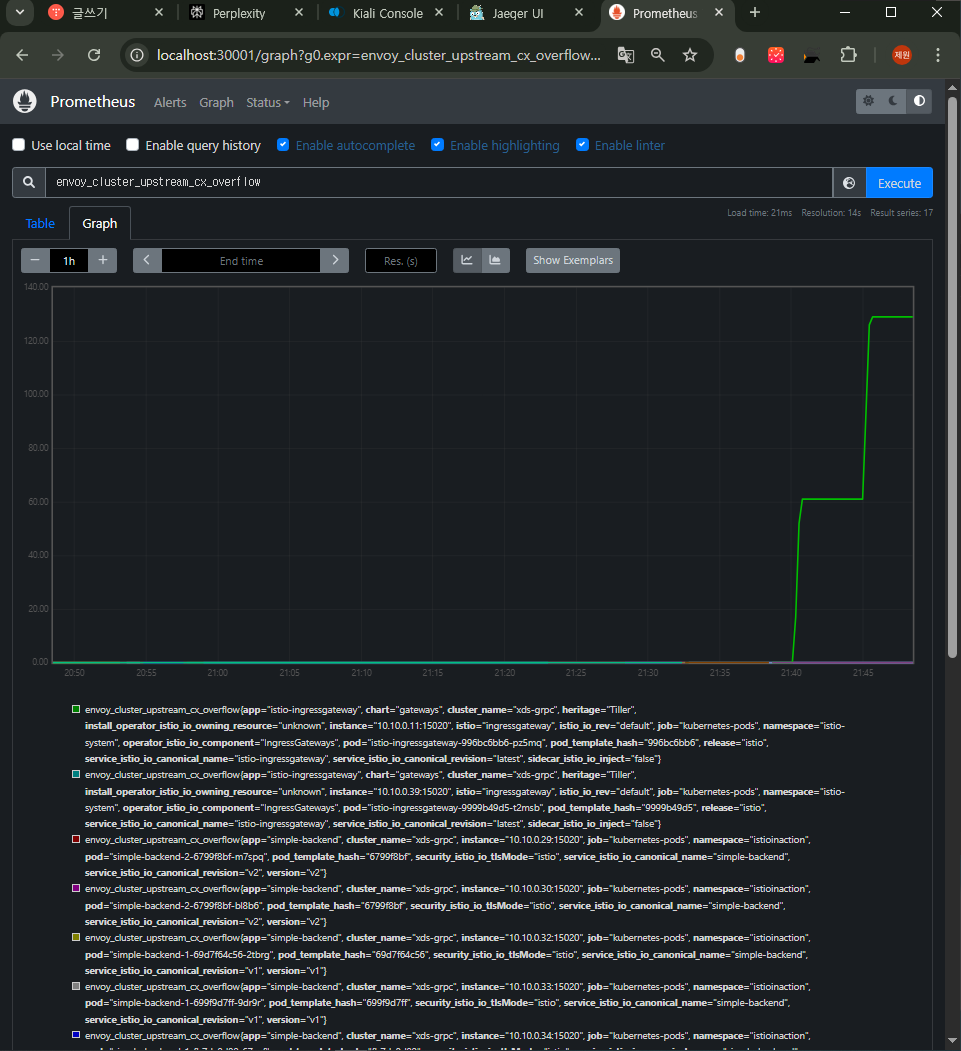
프로메테우스 메트릭 링크 envoy_cluster_upstream_rq_pending_overflow - Link
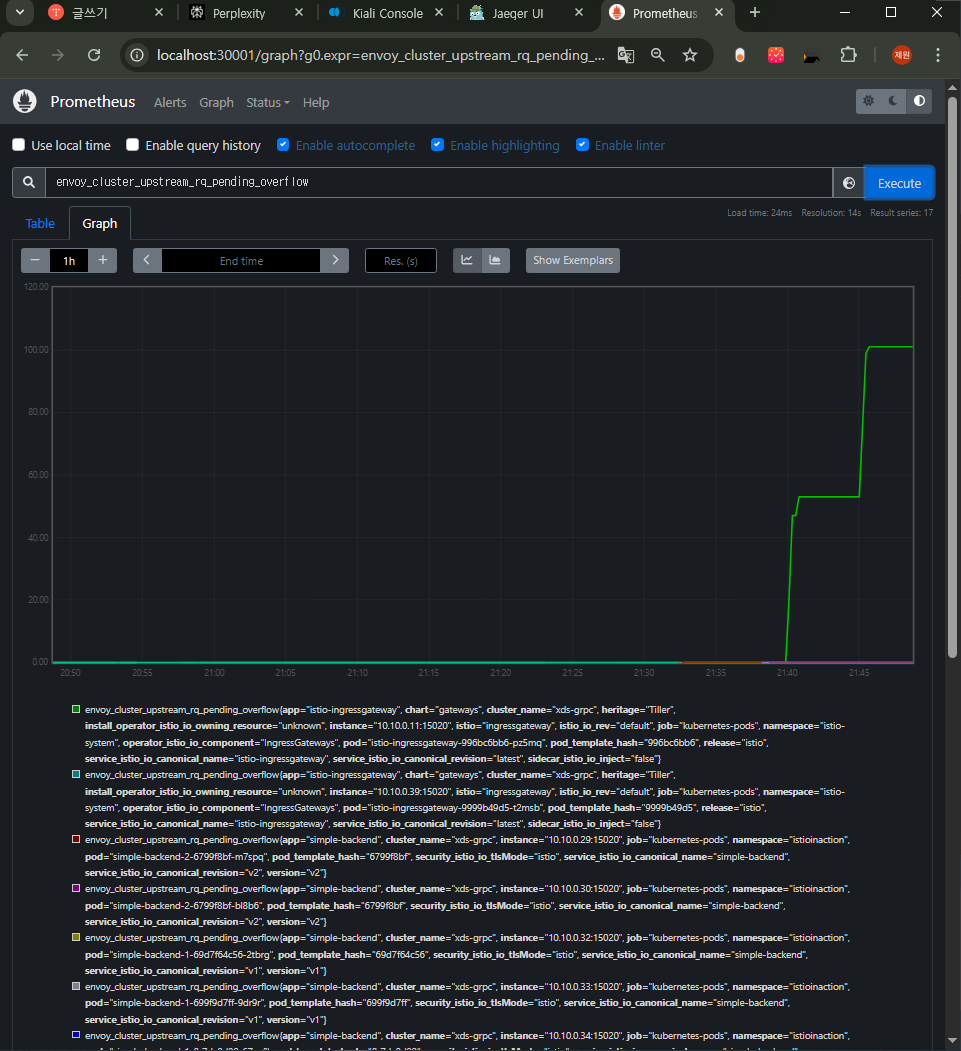
병렬로 발생하는 요청(현재 로드테스트 동시 요청 2)을 더 처리하고자 http2MaxRequests(parallel requests)를 늘려보자
# 설정 전 확인
docker exec -it myk8s-control-plane istioctl proxy-config cluster deploy/simple-web.istioinaction --fqdn simple-backend.istioinaction.svc.cluster.local -o json | grep maxRequests
docker exec -it myk8s-control-plane istioctl proxy-config cluster deploy/simple-backend-1.istioinaction --fqdn simple-backend.istioinaction.svc.cluster.local -o json | grep maxRequests
                    "maxRequests": 1,
                    "maxRequestsPerConnection": 1

# http2MaxRequests 조정: 1 → 2, '동시요청 처리개수'를 늘림
kubectl patch destinationrule simple-backend-dr -n istioinaction \
-n istioinaction --type merge --patch \
'{"spec": {"trafficPolicy": {"connectionPool": {"http": {"http2MaxRequests": 2}}}}}'

# 설정 후 확인
docker exec -it myk8s-control-plane istioctl proxy-config cluster deploy/simple-backend-1.istioinaction --fqdn simple-backend.istioinaction.svc.cluster.local -o json | grep maxRequests
                    "maxRequests": 2,
                    "maxRequestsPerConnection": 1

# istio-proxy stats 카운터 초기화
kubectl exec -it deploy/simple-web -c istio-proxy -n istioinaction \
-- curl -X POST localhost:15000/reset_counters

# 로그 확인 : simple-web >> 아래 500(503) 발생 로그 확인
kubectl logs -n istioinaction -l app=simple-web -c istio-proxy -f
...
## jaeger 에서 Tags 필터링 찾기 : guid:x-request-id=3e1789ba-2fa4-94b6-a782-cfdf0a405e13
[2025-04-22T03:55:22.424Z] "GET / HTTP/1.1" 503 UO upstream_reset_before_response_started{overflow} - "-" 0 81 0 - "172.18.0.1" "fortio.org/fortio-1.69.3" "3e1789ba-2fa4-94b6-a782-cfdf0a405e13" "simple-backend:80" "-" outbound|80||simple-backend.istioinaction.svc.cluster.local - 10.200.1.137:80 172.18.0.1:0 - -
[2025-04-22T03:55:22.410Z] "GET / HTTP/1.1" 500 - via_upstream - "-" 0 688 15 15 "172.18.0.1" "fortio.org/fortio-1.69.3" "3e1789ba-2fa4-94b6-a782-cfdf0a405e13" "simple-web.istioinaction.io:30000" "10.10.0.18:8080" inbound|8080|| 127.0.0.6:43259 10.10.0.18:8080 172.18.0.1:0 outbound_.80_._.simple-web.istioinaction.svc.cluster.local default
...

# 로그 확인 : simple-backend >> 503 에러가 발생하지 않았다???
kubectl logs -n istioinaction -l app=simple-backend -c istio-proxy -f


# 2개의 커넥션에서 요청을 초당 하나씩 보내기 : 동시요청 처리개수가 기존 1 에서 2로 증가되어서 거의 대부분 처리했다. >> 참고로 모두 성공 되기도함.
fortio load -quiet -jitter -t 30s -c 2 -qps 2 --allow-initial-errors http://simple-web.istioinaction.io:30000
...
Sockets used: 3 (for perfect keepalive, would be 2)
Code 200 : 33 (97.1 %)
Code 500 : 1 (2.9 %)
All done 34 calls (plus 2 warmup) 1789.433 ms avg, 1.1 qps
...

# 'cx_overflow: 40' 대비 'rq_pending_overflow: 1' 가 현저히 낮아짐을 확인
kubectl exec -it deploy/simple-web -c istio-proxy -n istioinaction \
 -- curl localhost:15000/stats | grep simple-backend | grep overflow
cluster.outbound|80||simple-backend.istioinaction.svc.cluster.local.upstream_cx_overflow: 40
cluster.outbound|80||simple-backend.istioinaction.svc.cluster.local.upstream_cx_pool_overflow: 0
cluster.outbound|80||simple-backend.istioinaction.svc.cluster.local.upstream_rq_pending_overflow: 1
cluster.outbound|80||simple-backend.istioinaction.svc.cluster.local.upstream_rq_retry_overflow: 0

kubectl exec -it deploy/simple-web -c istio-proxy -n istioinaction \
 -- curl localhost:15000/stats | grep simple-backend.istioinaction.svc.cluster.local.upstream

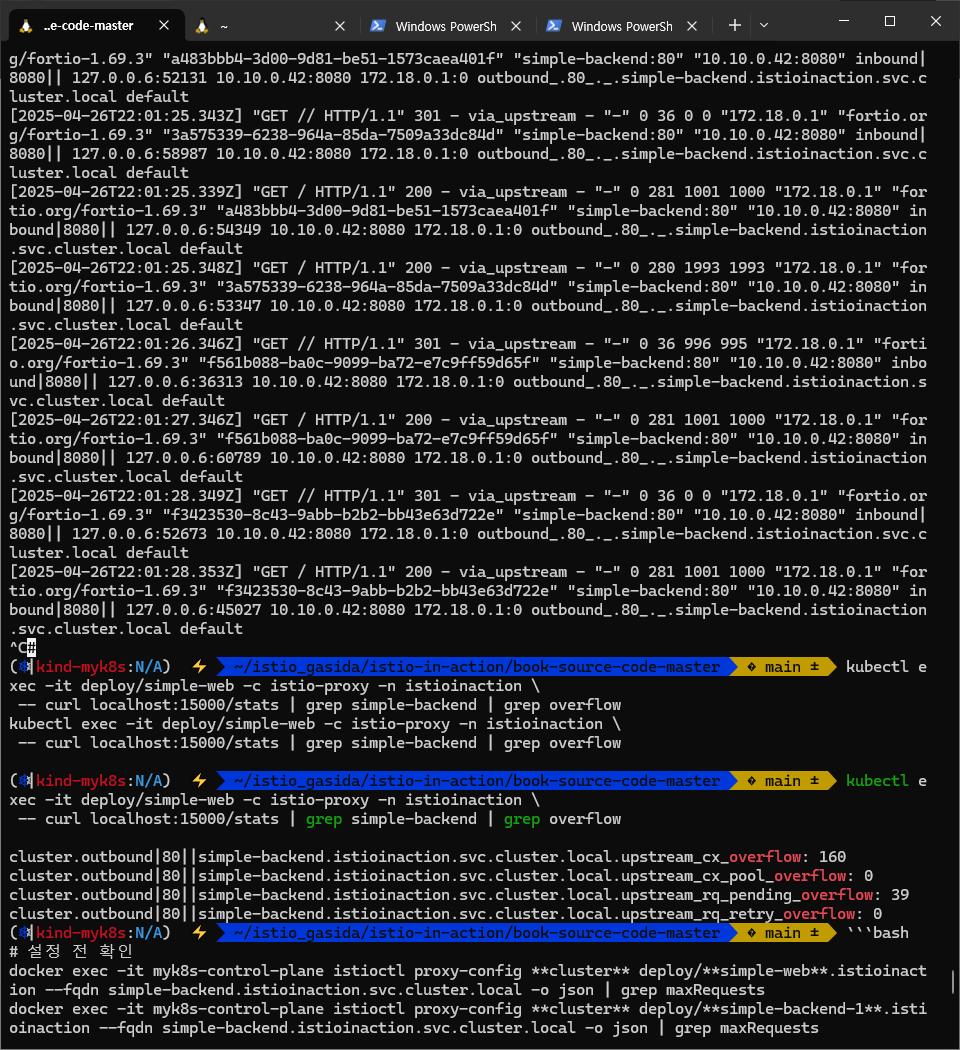
흠... 제대로 동작하지 않는 것 같음.. pending_overflow 가 아직 그대로..
- 요청 일부가(위에서는 1) 보류 대기열 서킷 브레이커를 작동시켰을 가능성이 있다.
- What likely happened is that some requests tripped the pending queue circuit breaker.
- kiali 확인 : 실제 simple-web 입장에서는 500(503) 출력되었지만, simple-backend 에는 503이 없다….
jaeger 에서 Tags 필터링 찾기 : guid:x-request-id=3e1789ba-2fa4-94b6-a782-cfdf0a405e13 , guid:x-request-id=304fd07c-0d09-9749-8e36-c0758c7464e3
simple-backend 에서는 정상 301 응답을 주었고, simple-web 에서 503 (UO)발생 되었다. 503발생 주체는 simple-web istio-proxy인가??
보류 대기열 깊이를 2로 늘리고 다시 실행해보자. Let’s increase the pending queue depth to 2 and re-run
# http1MaxPendingRequests : 1 → 2, 'queuing' 개수를 늘립니다
kubectl patch destinationrule simple-backend-dr \
-n istioinaction --type merge --patch \
'{"spec": {"trafficPolicy": {"connectionPool": {"http": {"http1MaxPendingRequests": 2}}}}}'

#
docker exec -it myk8s-control-plane istioctl proxy-config cluster deploy/simple-web.istioinaction --fqdn simple-backend.istioinaction.svc.cluster.local -o json | grep maxPendingRequests
docker exec -it myk8s-control-plane istioctl proxy-config cluster deploy/simple-backend-1.istioinaction --fqdn simple-backend.istioinaction.svc.cluster.local -o json | grep maxPendingRequests
                    "maxPendingRequests": 2,

# istio-proxy stats 카운터 초기화
kubectl exec -it deploy/simple-web -c istio-proxy -n istioinaction \
-- curl -X POST localhost:15000/reset_counters


# 2개의 커넥션에서 요청을 초당 하나씩 보내기 : 모두 성공!
fortio load -quiet -jitter -t 30s -c 2 -qps 2 --allow-initial-errors http://simple-web.istioinaction.io:30000
...
Sockets used: 2 (for perfect keepalive, would be 2) # 큐 길이 증가 덕분에, 소켓을 2개만 사용했다.
Code 200 : 33 (100.0 %)
All done 33 calls (plus 2 warmup) 1846.745 ms avg, 1.1 qps
...

# 'cx_overflow가 45이 발생했지만, upstream_rq_pending_overflow 는 이다!
kubectl exec -it deploy/simple-web -c istio-proxy -n istioinaction \
 -- curl localhost:15000/stats | grep simple-backend | grep overflow
cluster.outbound|80||simple-backend.istioinaction.svc.cluster.local.upstream_cx_overflow: 45
cluster.outbound|80||simple-backend.istioinaction.svc.cluster.local.upstream_cx_pool_overflow: 0
cluster.outbound|80||simple-backend.istioinaction.svc.cluster.local.upstream_rq_pending_overflow: 0
cluster.outbound|80||simple-backend.istioinaction.svc.cluster.local.upstream_rq_retry_overflow: 0

kubectl exec -it deploy/simple-web -c istio-proxy -n istioinaction \
 -- curl localhost:15000/stats | grep simple-backend.istioinaction.svc.cluster.local.upstream

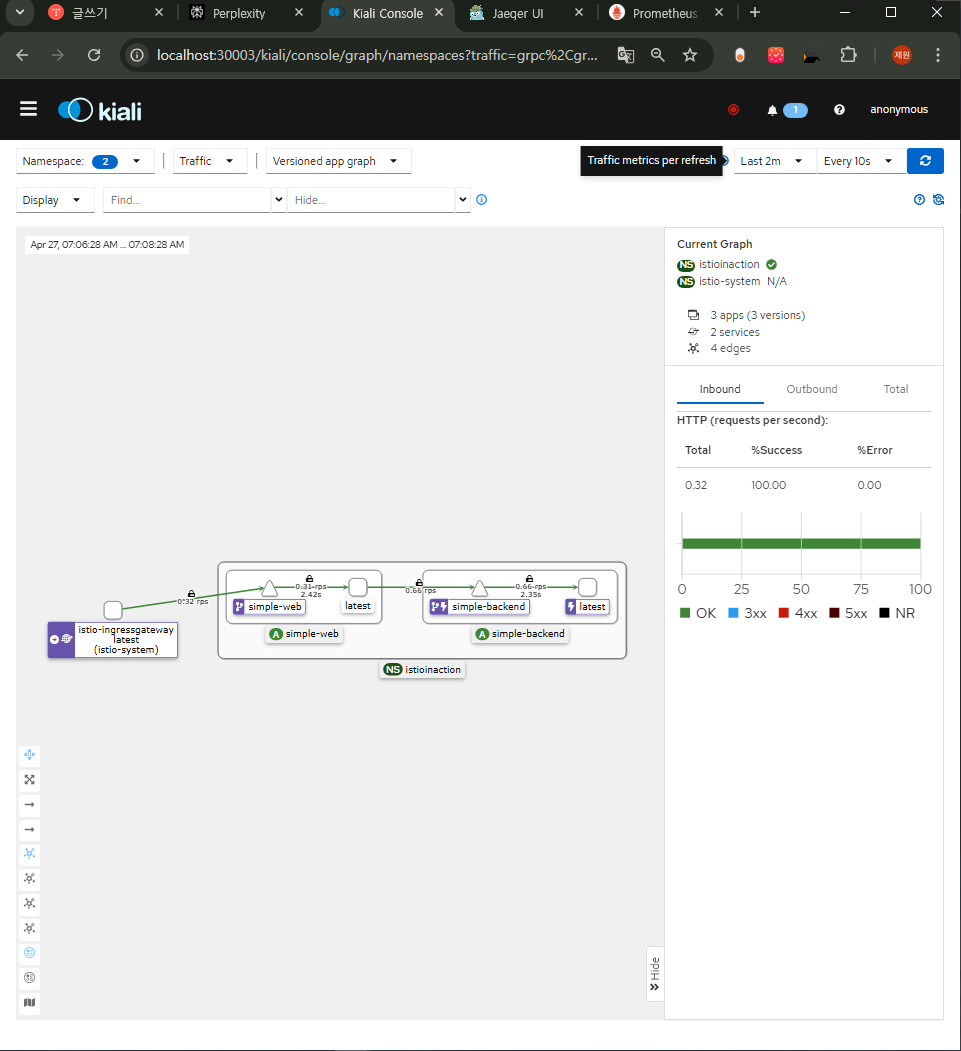
- 서킷 브레이커가 발동되면 통계를 보고 무슨 일이 일어났는지 확인 할 수 있다. 그런데 런타임은 어떤가?
- 우리 예제에서는 simple-web → simple-backend 를 호출한다. 그런데 서킷 브레이커 때문에 요청이 실패한다면, simple-web 은 그 사실을 어떻게 알고 애플리케이션이나 네트워크 장애 문제와 구별할 수 있는가?
- 요청 서킷 브레이커 임계값을 넘겨 실패하면, 이스티오 서비스 프록시는 x-envoy-overloaded 헤더를 추가한다.
- 이를 테스트하는 한 가지 방법은 커넥션 제한을 가장 엄격한 수준으로 설정하고(커넥션, 보류 요청, 최대 요청을 1로 설정함 1 for connections, pending requests, and maximum requests) 로드 테스트를 다시 수행해보는 것이다.
- 로드 테스트를 실행하는 도중에 단일 curl 명령도 실행하면 서킷 브레이커 때문에 실패할 가능성이 높다.
#
kubectl patch destinationrule simple-backend-dr \
-n istioinaction --type merge --patch \
'{"spec": {"trafficPolicy": {"connectionPool": {"http": {"http1MaxPendingRequests": 1}}}}}'

kubectl patch destinationrule simple-backend-dr -n istioinaction \
-n istioinaction --type merge --patch \
'{"spec": {"trafficPolicy": {"connectionPool": {"http": {"http2MaxRequests": 1}}}}}'

# 설정 적용 확인
docker exec -it myk8s-control-plane istioctl proxy-config cluster deploy/simple-backend-1.istioinaction --fqdn simple-backend.istioinaction.svc.cluster.local -o json

# istio-proxy stats 카운터 초기화
kubectl exec -it deploy/simple-web -c istio-proxy -n istioinaction \
-- curl -X POST localhost:15000/reset_counters

# 로드 테스트
fortio load -quiet -jitter -t 30s -c 2 -qps 2 --allow-initial-errors http://simple-web.istioinaction.io:30000

# 로드 테스트 하는 상태에서 아래 curl 접속
curl -v http://simple-web.istioinaction.io:30000
{
  "name": "simple-web",
  "uri": "/",
  "type": "HTTP",
  "ip_addresses": [
    "10.10.0.18"
  ],
  "start_time": "2025-04-22T04:23:50.468693",
  "end_time": "2025-04-22T04:23:50.474941",
  "duration": "6.247ms",
  "body": "Hello from simple-web!!!",
  "upstream_calls": [
    {
      "uri": "http://simple-backend:80/",
      "headers": {
        "Content-Length": "81",
        "Content-Type": "text/plain",
        "Date": "Tue, 22 Apr 2025 04:23:50 GMT",
        "Server": "envoy",
        "X-Envoy-Overloaded": "true" # Header indication
      },
      "code": 503,
      "error": "Error processing upstream request: http://simple-backend:80//, expected code 200, got 503"
    }
  ],
  "code": 500
}

tcpdump 후 wireshark 확인 : 흠.. 현재 실습 동작에서는 http 헤더에 추가되는 것이 아닌 것 같다… - Github
- 일반적으로 네트워크가 실패할 수 있다는 점을 감안해 애플리케이션 코드를 작성해야 한다.
- 애플리케이션 코드가 이 헤더를 확인하면 호출한 클라이언트에게 응답을 보내기 위해 대체 전략 fallback 을 사용하는 결정을 내릴 수 있다.
wsl 이랑 환경이 달라서 tcpdump 나중에 떠봐야 할듯
6.5.2 Guarding against unhealthy services with outlier detection* : 이상값 감지로 비정상 서비스에 대응하기
- 앞 절에서는 서비스에 예기치 못한 지연 시간이 있을 때 오동작하는 서비스로의 요청을 이스티오가 어떻게 제한할 수 있는지 살펴봤다.
- 이번 절에서는 오동작 misbehaving 하는 특정 호스트를 서비스에서 제거하는 이스티오의 접근법을 다룬다.
- 이스티오는 이를 위해 엔보이의 이상값 감지 기능을 사용한다. Istio uses Envoy’s outlier-detection functionality for this.
- 실습 환경 초기화
- 동작을 살펴보기 위해 이스티오의 기본 재시도 메커니즘도 비활성화 한다.
- 재시도와 이상값 감지는 잘 어울리지만, 이 예제에서는 이상값 감지 기능을 고립시키려고 한다.
- 재시도는 마지막에 추가해서 이상값 감지와 재시도가 서로 어떻게 보완하는지 확인해본다.
#
kubectl delete destinationrule --all -n istioinaction
kubectl delete vs simple-backend-vs -n istioinaction

# disable retries (default) : 이미 적용 되어 있음
docker exec -it myk8s-control-plane bash
----------------------------------------
istioctl install --set profile=default --set meshConfig.defaultHttpRetryPolicy.attempts=0
y
exit
----------------------------------------

#
kubectl apply -f ch6/simple-backend.yaml -n istioinaction
kubectl apply -f ch6/simple-web-stats-incl.yaml -n istioinaction # 통계 활성화

# istio-proxy stats 카운터 초기화
kubectl exec -it deploy/simple-web -c istio-proxy -n istioinaction \
-- curl -X POST localhost:15000/reset_counters

# 호출 테스트 : 모두 성공
fortio load -quiet -jitter -t 30s -c 2 -qps 2 --allow-initial-errors http://simple-web.istioinaction.io:30000

# 확인
kubectl exec -it deploy/simple-web -c istio-proxy -n istioinaction \
 -- curl localhost:15000/stats | grep simple-backend.istioinaction.svc.cluster.local.upstream

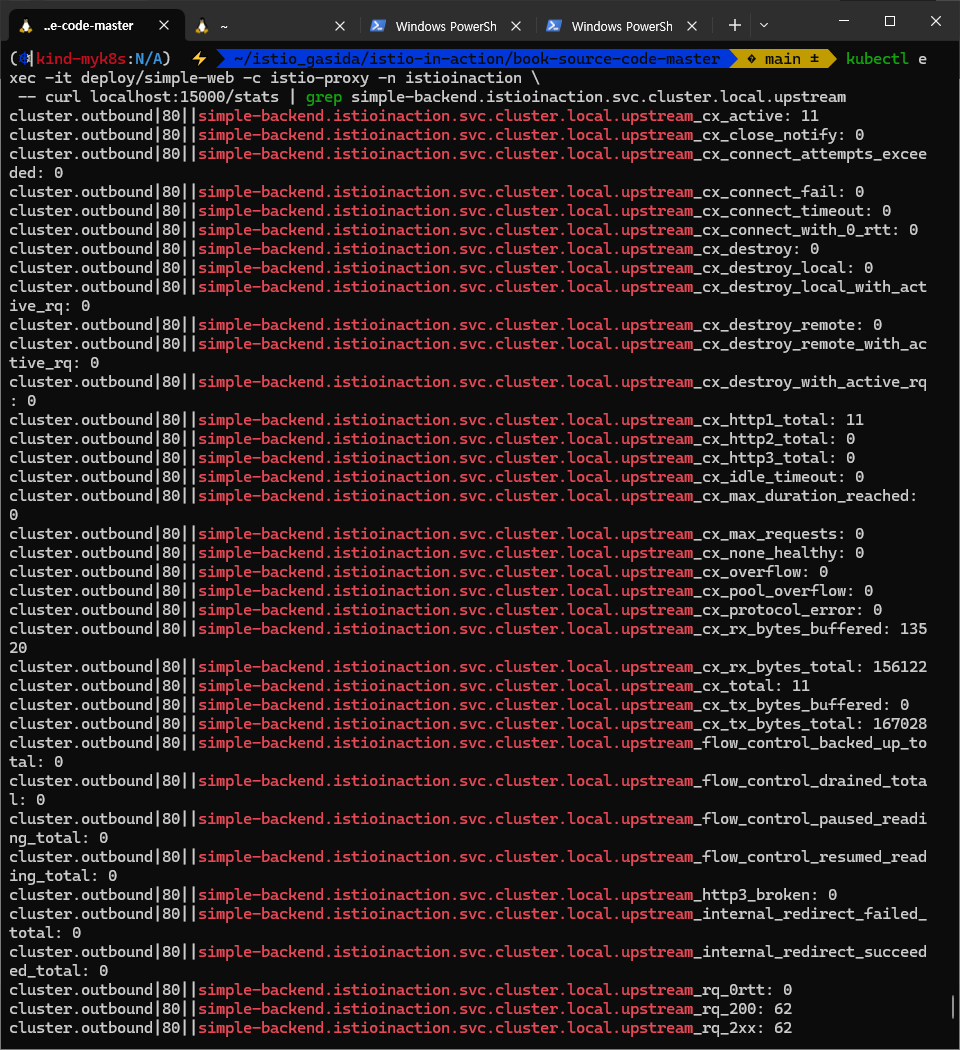
simple-backend-1 엔드포인트는 호출 중 75%가 HTTP 500 실패 설정 배포 및 확인
#
kubectl apply -n istioinaction -f ch6/simple-backend-periodic-failure-500.yaml
kubectl exec -it deploy/simple-backend-1 -n istioinaction -- env | grep ERROR

#
kubectl exec -it deploy/simple-backend-1 -n istioinaction -- sh
---------------------------------------------------------------
export ERROR_TYPE=http_error
export ERROR_RATE=0.75
export ERROR_CODE=500
exit
---------------------------------------------------------------

# 정보 확인
kubectl get deploy,pod -n istioinaction -o wide
NAME                               READY   UP-TO-DATE   AVAILABLE   AGE   CONTAINERS       IMAGES                                 SELECTOR
deployment.apps/simple-backend-1   1/1     1            1           20h   simple-backend   nicholasjackson/fake-service:v0.14.1   app=simple-backend
deployment.apps/simple-backend-2   2/2     2            2           20h   simple-backend   nicholasjackson/fake-service:v0.17.0   app=simple-backend
deployment.apps/simple-web         1/1     1            1           21h   simple-web       nicholasjackson/fake-service:v0.17.0   app=simple-web

NAME                                   READY   STATUS    RESTARTS   AGE     IP           NODE                  NOMINATED NODE   READINESS GATES
pod/simple-backend-1-bdb6c7ff8-rqqlr   2/2     Running   0          2m25s   10.10.0.30   myk8s-control-plane   <none>           <none>
pod/simple-backend-2-6799f8bf-d4b6t    2/2     Running   0          11m     10.10.0.27   myk8s-control-plane   <none>           <none>
pod/simple-backend-2-6799f8bf-dk78j    2/2     Running   0          11m     10.10.0.29   myk8s-control-plane   <none>           <none>
pod/simple-web-865f4949ff-56kbq        2/2     Running   0          3h32m   10.10.0.18   myk8s-control-plane   <none>           <none>


# 로드 테스트 실행 : 재시도를 끄고, backend-1 엔드포인트에 주기적인 실패를 설정했으니, 테스트 일부는 실패
fortio load -quiet -jitter -t 30s -c 2 -qps 2 --allow-initial-errors http://simple-web.istioinaction.io:30000
...
Sockets used: 19 (for perfect keepalive, would be 2)
Code 200 : 43 (71.7 %)
Code 500 : 17 (28.3 %)
All done 60 calls (plus 2 warmup) 134.138 ms avg, 2.0 qps
...

# 통계 확인
kubectl exec -it deploy/simple-web -c istio-proxy -n istioinaction \
 -- curl localhost:15000/stats | grep simple-backend.istioinaction.svc.cluster.local.upstream

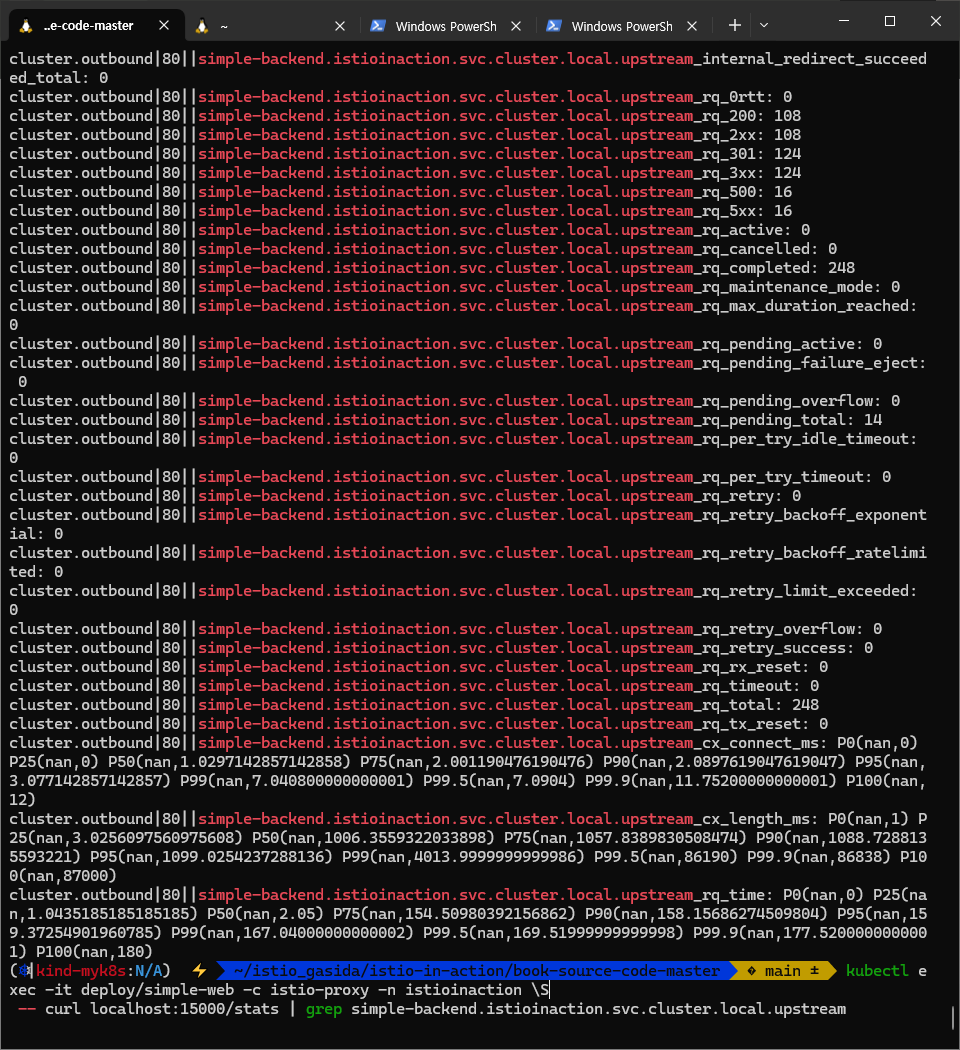
- 정기적으로 실패하는 서비스에 요청을 보내고 있는데 서비스의 다른 엔드포인트들은 실패하지 않고 있다면, 해당 엔드포인트가 과부하됐거나 어떤 이유로든 성능이 저하된 상태일 수 있으므로 당분간 그 엔드포인트로 트래픽을 전송하는 것을 멈춰야 한다.
- 이상값 감지를 설정해보자 : 기존 오류율 대비 극적으로 감소. 오동작하는 엔드포인트를 잠시 제거했기 때문이다. - Docs
- consecutive5xxErrors: 잘못된 요청이 하나만 발생해도 이상값 감지가 발동. 기본값 5, 연속적인 에러 횟수 threshold
- interval: 이스티오 서비스 프록시가 체크하는 주기. 기본값 10초. Time interval between ejection sweep analysis
- baseEjectionTime: 서비스 엔드포인트에서 제거된다면, 제거 시간은 n(해당 엔드포인트가 쫓겨난 횟수) * baseEjectionTime.
- 해당 시간이 지나면 로드 밸런싱 풀에 다시 추가됨. 기본값 30초.
- maxEjectionPercent: 로드 밸런싱 풀에서 제거 가능한 호스트 개수(%).
- 100% 설정 시모든 호스트가 오동작하면 어떤 요청도 통과 못함(회로가 열린 것과 같다). 기본값 10%
#
cat ch6/simple-backend-dr-outlier-5s.yaml
apiVersion: networking.istio.io/v1beta1
kind: DestinationRule
metadata:
  name: simple-backend-dr
spec:
  host: simple-backend.istioinaction.svc.cluster.local
  trafficPolicy:
    outlierDetection:
      consecutive5xxErrors: 1 # 잘못된 요청이 하나만 발생해도 이상값 감지가 발동. 기본값 5
      interval: 5s # 이스티오 서비스 프록시가 체크하는 주기. 기본값 10초. Time interval between ejection sweep analysis
      baseEjectionTime: 5s # 서비스 엔드포인트에서 제거된다면, 제거 시간은 n(해당 엔드포인트가 쫓겨난 횟수) * baseEjectionTime. 해당 시간이 지나면 로드 밸런싱 풀에 다시 추가됨. 기본값 30초.
      maxEjectionPercent: 100 # 로드 밸런싱 풀에서 제거 가능한 호스트 개수(%). 모든 호스트가 오동작하면 어떤 요청도 통과 못함(회로가 열린 것과 같다). 기본값 10%

kubectl apply -f ch6/simple-backend-dr-outlier-5s.yaml -n istioinaction
kubectl get dr -n istioinaction

#
docker exec -it myk8s-control-plane istioctl proxy-config cluster deploy/simple-web.istioinaction --fqdn simple-backend.istioinaction.svc.cluster.local -o json
...
        "outlierDetection": {
            "consecutive5xx": 1,
            "interval": "5s",
            "baseEjectionTime": "5s",
            "maxEjectionPercent": 100,
            "enforcingConsecutive5xx": 100,
            "enforcingSuccessRate": 0
        },
...

docker exec -it myk8s-control-plane istioctl proxy-config endpoint deploy/simple-web.istioinaction --cluster 'outbound|80||simple-backend.istioinaction.svc.cluster.local'
ENDPOINT            STATUS      OUTLIER CHECK     CLUSTER
10.10.0.27:8080     HEALTHY     OK                outbound|80||simple-backend.istioinaction.svc.cluster.local
10.10.0.29:8080     HEALTHY     OK                outbound|80||simple-backend.istioinaction.svc.cluster.local
10.10.0.30:8080     HEALTHY     OK                outbound|80||simple-backend.istioinaction.svc.cluster.local


# 통계 초기화
kubectl exec -it deploy/simple-web -c istio-proxy -n istioinaction \
-- curl -X POST localhost:15000/reset_counters

# 엔드포인트 모니터링 먼저 해두기 : 신규 터미널
	while true; do docker exec -it myk8s-control-plane istioctl proxy-config endpoint deploy/simple-web.istioinaction --cluster 'outbound|80||simple-backend.istioinaction.svc.cluster.local' ; date; sleep 1; echo; done
	ENDPOINT            STATUS      OUTLIER CHECK     CLUSTER
10.10.0.27:8080     HEALTHY     OK                outbound|80||simple-backend.istioinaction.svc.cluster.local
10.10.0.29:8080     HEALTHY     OK                outbound|80||simple-backend.istioinaction.svc.cluster.local
10.10.0.30:8080     HEALTHY     FAILED            outbound|80||simple-backend.istioinaction.svc.cluster.local


# 로드 테스트 실행 : 기존 오류율 대비 극적으로 감소. 오동작하는 엔드포인트를 잠시 제거했기 때문이다.
fortio load -quiet -jitter -t 30s -c 2 -qps 2 --allow-initial-errors http://simple-web.istioinaction.io:30000
...
Sockets used: 5 (for perfect keepalive, would be 2)
Code 200 : 58 (96.7 %)
Code 500 : 2 (3.3 %)
All done 60 calls (plus 2 warmup) 166.592 ms avg, 2.0 qps
...

# 통계 확인
kubectl exec -it deploy/simple-web -c istio-proxy -n istioinaction \
 -- curl localhost:15000/stats | grep simple-backend.istioinaction.svc.cluster.local.upstream

# 엔드포인트 이상 감지 전에 3번 실패했고, 이상 상태가 되고 나면 로드 밸런서 풀에서 제거되어서 이후 부터는 정상 엔드포인트로 호출 응답됨.
kubectl exec -it deploy/simple-web -c istio-proxy -n istioinaction \
 -- curl localhost:15000/stats | grep simple-backend | grep outlier
cluster.outbound|80||simple-backend.istioinaction.svc.cluster.local.outlier_detection.ejections_active: 0
cluster.outbound|80||simple-backend.istioinaction.svc.cluster.local.outlier_detection.ejections_consecutive_5xx: 3
cluster.outbound|80||simple-backend.istioinaction.svc.cluster.local.outlier_detection.ejections_detected_consecutive_5xx: 3
cluster.outbound|80||simple-backend.istioinaction.svc.cluster.local.outlier_detection.ejections_detected_consecutive_gateway_failure: 0
cluster.outbound|80||simple-backend.istioinaction.svc.cluster.local.outlier_detection.ejections_detected_consecutive_local_origin_failure: 0
cluster.outbound|80||simple-backend.istioinaction.svc.cluster.local.outlier_detection.ejections_detected_failure_percentage: 0
cluster.outbound|80||simple-backend.istioinaction.svc.cluster.local.outlier_detection.ejections_detected_local_origin_failure_percentage: 0
cluster.outbound|80||simple-backend.istioinaction.svc.cluster.local.outlier_detection.ejections_detected_local_origin_success_rate: 0
cluster.outbound|80||simple-backend.istioinaction.svc.cluster.local.outlier_detection.ejections_detected_success_rate: 0
cluster.outbound|80||simple-backend.istioinaction.svc.cluster.local.outlier_detection.ejections_enforced_consecutive_5xx: 3
cluster.outbound|80||simple-backend.istioinaction.svc.cluster.local.outlier_detection.ejections_enforced_consecutive_gateway_failure: 0
cluster.outbound|80||simple-backend.istioinaction.svc.cluster.local.outlier_detection.ejections_enforced_consecutive_local_origin_failure: 0
cluster.outbound|80||simple-backend.istioinaction.svc.cluster.local.outlier_detection.ejections_enforced_failure_percentage: 0
cluster.outbound|80||simple-backend.istioinaction.svc.cluster.local.outlier_detection.ejections_enforced_local_origin_failure_percentage: 0
cluster.outbound|80||simple-backend.istioinaction.svc.cluster.local.outlier_detection.ejections_enforced_local_origin_success_rate: 0
cluster.outbound|80||simple-backend.istioinaction.svc.cluster.local.outlier_detection.ejections_enforced_success_rate: 0
cluster.outbound|80||simple-backend.istioinaction.svc.cluster.local.outlier_detection.ejections_enforced_total: 3
cluster.outbound|80||simple-backend.istioinaction.svc.cluster.local.outlier_detection.ejections_overflow: 0
cluster.outbound|80||simple-backend.istioinaction.svc.cluster.local.outlier_detection.ejections_success_rate: 0
cluster.outbound|80||simple-backend.istioinaction.svc.cluster.local.outlier_detection.ejections_total: 3


# 5초 후(baseEjectionTime: 5s) 다시 엔드포인트 모니터링
ENDPOINT            STATUS      OUTLIER CHECK     CLUSTER
10.10.0.27:8080     HEALTHY     OK                outbound|80||simple-backend.istioinaction.svc.cluster.local
10.10.0.29:8080     HEALTHY     OK                outbound|80||simple-backend.istioinaction.svc.cluster.local
10.10.0.30:8080     HEALTHY     OK                outbound|80||simple-backend.istioinaction.svc.cluster.local


오류률을 더 개선해보자. 기본 재시도 설정을 추가해보자. VirtuslService 에 명시적으로 설정 가능. (현재 mesh 기본 재시도 0 상태)
#
cat ch6/simple-backend-vs-retry-500.yaml
apiVersion: networking.istio.io/v1alpha3
kind: VirtualService
metadata:
  name: simple-backend-vs
spec:
  hosts:
  - simple-backend
  http:
  - route:
    - destination:
        host: simple-backend
    retries:
      attempts: 2
      retryOn: 5x

kubectl apply -f ch6/simple-backend-vs-retry-500.yaml -n istioinaction

# 통계 초기화
kubectl exec -it deploy/simple-web -c istio-proxy -n istioinaction \
-- curl -X POST localhost:15000/reset_counters

# 엔드포인트 모니터링 먼저 해두기 : 신규 터미널
while true; do docker exec -it myk8s-control-plane istioctl proxy-config endpoint deploy/simple-web.istioinaction --cluster 'outbound|80||simple-backend.istioinaction.svc.cluster.local' ; date; sleep 1; echo; done

# 로드 테스트 실행 : 모두 성공!
fortio load -quiet -jitter -t 30s -c 2 -qps 2 --allow-initial-errors http://simple-web.istioinaction.io:30000
...
Sockets used: 2 (for perfect keepalive, would be 2)
Code 200 : 60 (100.0 %)
All done 60 calls (plus 2 warmup) 173.837 ms avg, 2.0 qps
...

# 엔드포인트 이상 감지 전에 3번 실패했지만, 재시도 retry 덕분에 결과적으로 모두 성공!
kubectl exec -it deploy/simple-web -c istio-proxy -n istioinaction \
 -- curl localhost:15000/stats | grep simple-backend | grep outlier

# 통계 확인
kubectl exec -it deploy/simple-web -c istio-proxy -n istioinaction \
 -- curl localhost:15000/stats | grep simple-backend.istioinaction.svc.cluster.local.upstream | grep retry
cluster.outbound|80||simple-backend.istioinaction.svc.cluster.local.upstream_rq_retry: 4
cluster.outbound|80||simple-backend.istioinaction.svc.cluster.local.upstream_rq_retry_backoff_exponential: 4
cluster.outbound|80||simple-backend.istioinaction.svc.cluster.local.upstream_rq_retry_backoff_ratelimited: 0
cluster.outbound|80||simple-backend.istioinaction.svc.cluster.local.upstream_rq_retry_limit_exceeded: 0
cluster.outbound|80||simple-backend.istioinaction.svc.cluster.local.upstream_rq_retry_overflow: 0
cluster.outbound|80||simple-backend.istioinaction.svc.cluster.local.upstream_rq_retry_success: 4


jaeger 확인 : 아래 처럼 재시도해서 최종적으로 사용자 입장에서는 정상 응답

로드 테스트를 다시 실행하면 오류가 없음을 확인할 수 있다.
- 이번 장 이전에는 이스티오의 기능과 API를 사용해, 인그레스 게이트웨이를 사용한 예지에서부터 클러스터 내 통신에 이르기까지 네트워크의 동작을 바꾸는 방법을 살펴봤다.
- 그러나 이번 장의 서두에서 언급했듯이, 끊임없이 변화하는 대규모 시스템에서 예상치 못한 네트워크 오류에 대응하기 위한 수동적인 개입은 불가능에 가까운 것이다.
- 이번 장에서의 이스티오의 다양한 클라이언트 측 복원력 기능을 깊이 들여다봤다.
- 이 기능들은 서비스가 간헐적인 네트워크 문제나 토폴로지 변화로부터 투명하게 복구될 수 있도록 돕는다.
- 다음 장에서는 이런 기능을 더해 네트워크 동작을 관찰하는 방법을 살펴볼 것이다.
Summary
- 로드 밸런싱은 DestinationRule 리소스로 설정한다. 지원하는 알고리듬은 다음과 같다.
- ROUND_ROBIN은 요청을 엔드포인트에 차례대로(or next-in-loop) 전달하며 기본 알고리듬이다.
- RANDOM은 트래픽을 무작위 엔드포인트로 라우팅한다.
- LEAST_CONN은 진행 중인 요청이 가장 적은 엔드포인트로 트래픽을 라우팅한다.
- 이스티오는 노드의 영역 및 리전 정보를 엔드포인트 상태 정보(outlierDetection 이 설정돼 있어야 함)와 함께 활용해 트래픽을 동일 영역 내의 워크로드로 라우팅한다. (가능한 경우 그렇게 하고, 그렇지 않을 경우 다음 영역으로 넘긴다)
- DestinationRule 를 사용하면 클라이언트가 여러 지역에 가중치를 부여해 트래픽을 분배하도록 설정할 수 있다.
- 재시도와 타임아웃은 VirtualService 리소스에서 설정한다.
- EnvoyFilter 리소스를 사용하면 이스티오 API가 노출하지 않은 엔보이의 기능을 구현할 수 있다. 요청 헤징으로 이를 보여줬다.
- 서킷 브레이커는 DestinationRule 리소스에서 설정하는데, 이 기능은 트래픽을 더 전송하기 전에 업스트림 서비스가 회복할 시간을 벌어준다.
실습 후 삭제 : kind delete cluster --name myk8s , /etc/hosts 파일에 추가했던 도메인 제거