
7. 관찰가능성 Observability: Understanding the behavior of your services
This chapter covers
- 기본적인 요청 수준 메트릭 수집하기 Collecting basic request-level metrics
- 이스티오의 서비스 간 표준 메트릭 이해하기 Understanding Istio’s standard service-to-service metrics
- 프로메테우스로 워크로드 및 컨트롤 플레인 메트릭 긁어오기 Using Prometheus to scrape workload and control-plane metrics
- 이스티오에 프로메테우스에서 추적할 새 메트릭 추가하기 Adding new metrics in Istio to track in Prometheus
- 들어가며 : 관찰 가능성 ← 장애 발생 시 빠르게 복구 시간 MTTR 개선 도움
- 최근 관찰 가능성 Observability 이란 용어가 소프트웨어 엔지니어, 운영, SRE 팀 사이에서 점점 더 자주 입에 오르기 시작할 것을 알고 있을지도 모르겠다.
- 이 팀들은 클라우드 인프라에서 마이크로서비스 스타일 아키텍처를 운영할 때 거의 기하급수적으로 증가하는 복잡성을 처리해야 한다.
- 애플리케이션을 수십, 수백개 혹은 그 이상의 서비스로 배포하기 시작하면 움직이는 부분의 수, 네트워크에 대한 의존도, 잘못될 수 있고 또 실제로 잘못되는 것들의 개수가 모두 늘어난다.
- 시스템이 이런 방향으로 더 커지면, 최소한 시스템의 일부는 항상 성능 저하 상태로 운영될 가능성이 높다.
- 따라서 애플리케이션을 좀 더 안정적이고 복원력 있게 구축해야 할 뿐 아니라, 애플리케이션이 실행 중일 때 실제로 어떤 일이 일어나고 있는지 이해할 수 있도록 도구와 계측 기법도 개선해야 한다.
- 런타임에 서비스와 인프라에 어떤 일이 일어나고 있는지 자신 있게 이해할 수 있다면 예상치 못한 것을 봤을 때 장애를 감지하고 디버깅에 깊이 파고들 수 있다.
- 이런 노력은 평균 복구 시간 MTTR, Mean Time To Recovery 을 개선하는 데 도움이 될 것이다.
- MTTR은 팀의 성과와 비즈니스에 대한 팀의 영향을 측정하는 중요한 지표다.
- 이번 장에서는 관찰 가능성의 기본 사항 몇 가지를 살펴보고, 이스티오가 관찰 가능성을 보조하는 네트워크 수준 메트릭 수집의 기반을 마련하는 데 어떻게 도움이 되는지 알아본다.
- 8장에서는 이를 기반으로, 이 정보 일부를 사용해 네트워크 호출 그래프를 시각적으로 이해하는 방법을 다룰 것이다.
[실습 환경 구성] k8s(1.23.17) 배포 : NodePort(30000 HTTP, 30005 HTTPS)
#
git clone https://github.com/AcornPublishing/istio-in-action
cd istio-in-action/book-source-code-master
pwd # 각자 자신의 pwd 경로
code .

# 아래 extramounts 생략 시, myk8s-control-plane 컨테이너 sh/bash 진입 후 직접 git clone 가능
kind create cluster --name myk8s --image kindest/node:v1.23.17 --config - <<EOF
kind: Cluster
apiVersion: kind.x-k8s.io/v1alpha4
nodes:
- role: control-plane
  extraPortMappings:
  - containerPort: 30000 # Sample Application (istio-ingrssgateway) HTTP
    hostPort: 30000
  - containerPort: 30001 # Prometheus
    hostPort: 30001
  - containerPort: 30002 # Grafana
    hostPort: 30002
  - containerPort: 30003 # Kiali
    hostPort: 30003
  - containerPort: 30004 # Tracing
    hostPort: 30004
  - containerPort: 30005 # Sample Application (istio-ingrssgateway) HTTPS
    hostPort: 30005
  - containerPort: 30006 # TCP Route
    hostPort: 30006
  - containerPort: 30007 # kube-ops-view
    hostPort: 30007
  kubeadmConfigPatches:
  - |
    kind: ClusterConfiguration
    controllerManager:
      extraArgs:
        bind-address: 0.0.0.0
  extraMounts: # 해당 부분 생략 가능
  - hostPath: /Users/gasida/Downloads/istio-in-action/book-source-code-master # 각자 자신의 pwd 경로로 설정
    containerPath: /istiobook
networking:
  podSubnet: 10.10.0.0/16
  serviceSubnet: 10.200.1.0/24
EOF

# 설치 확인
docker ps

# 노드에 기본 툴 설치
docker exec -it myk8s-control-plane sh -c 'apt update && apt install tree psmisc lsof wget bridge-utils net-tools dnsutils tcpdump ngrep iputils-ping git vim -y'

# (옵션) kube-ops-view
helm repo add geek-cookbook https://geek-cookbook.github.io/charts/
helm install kube-ops-view geek-cookbook/kube-ops-view --version 1.2.2 --set service.main.type=NodePort,service.main.ports.http.nodePort=30007 --set env.TZ="Asia/Seoul" --namespace kube-system
kubectl get deploy,pod,svc,ep -n kube-system -l app.kubernetes.io/instance=kube-ops-view

## kube-ops-view 접속 URL 확인
open "http://localhost:30007/#scale=1.5"
open "http://localhost:30007/#scale=1.3"

# (옵션) metrics-server
helm repo add metrics-server https://kubernetes-sigs.github.io/metrics-server/
helm install metrics-server metrics-server/metrics-server --set 'args[0]=--kubelet-insecure-tls' -n kube-system
kubectl get all -n kube-system -l app.kubernetes.io/instance=metrics-server
[실습 환경 구성] istio 1.17.8 설치 - Docs , Install , profile ⇒ 추후에 istio profile 을 demo 로 변경해둘것.
# myk8s-control-plane 진입 후 설치 진행
docker exec -it myk8s-control-plane bash
-----------------------------------
# (옵션) 코드 파일들 마운트 확인
tree /istiobook/ -L 1
혹은
git clone ... /istiobook

# istioctl 설치
export ISTIOV=1.17.8
echo 'export ISTIOV=1.17.8' >> /root/.bashrc

curl -s -L https://istio.io/downloadIstio | ISTIO_VERSION=$ISTIOV sh -
cp istio-$ISTIOV/bin/istioctl /usr/local/bin/istioctl
istioctl version --remote=false

# default 프로파일 컨트롤 플레인 배포
istioctl install --set profile=default -y

# 빠져나오기
exit
-----------------------------------

# 설치 확인 : istiod, istio-ingressgateway, crd 등
kubectl get istiooperators -n istio-system -o yaml
kubectl get all,svc,ep,sa,cm,secret,pdb -n istio-system
kubectl get cm -n istio-system istio -o yaml
kubectl get crd | grep istio.io | sort

# 실습을 위한 네임스페이스 설정
kubectl create ns istioinaction
kubectl label namespace istioinaction istio-injection=enabled
kubectl get ns --show-labels

# istio-ingressgateway 서비스 : NodePort 변경 및 nodeport 지정 변경 , externalTrafficPolicy 설정 (ClientIP 수집)
kubectl patch svc -n istio-system istio-ingressgateway -p '{"spec": {"type": "NodePort", "ports": [{"port": 80, "targetPort": 8080, "nodePort": 30000}]}}'
kubectl patch svc -n istio-system istio-ingressgateway -p '{"spec": {"type": "NodePort", "ports": [{"port": 443, "targetPort": 8443, "nodePort": 30005}]}}'
kubectl patch svc -n istio-system istio-ingressgateway -p '{"spec":{"externalTrafficPolicy": "Local"}}'
kubectl describe svc -n istio-system istio-ingressgateway


# 내부 접속 테스트용 netshoot 파드 생성
cat <<EOF | kubectl apply -f -
apiVersion: v1
kind: Pod
metadata:
  name: netshoot
spec:
  containers:
  - name: netshoot
    image: nicolaka/netshoot
    command: ["tail"]
    args: ["-f", "/dev/null"]
  terminationGracePeriodSeconds: 0
EOF
7.1 What is observability? 관찰 가능성이란 무엇인가?
들어가며 : 이스티오는 애플리케이션 수준 네트워크 계측을 보조
- 관찰 가능성은 시스템의 특성 중 하나로, 외부 신호와 특성만 보고도 just by looking 시스템의 내부 상태 internal state ****를 이해하고 추론할 수 있는 수준을 나타낸다.
- 관찰 가능성은 런타임 동작을 변경할 수 있는 제어 기능을 시스템에 구현하는 데 중요하다.
- 이 개념은 루돌프 칼만 Rudolf E. Kalman 이 1960년 논문 ‘제어 시스템의 일반 이론에 관해 On the General Theory of Control Systems’ 에서 처음 발표한 제어 이론을 기반으로 한다.
- 좀 더 실용적인 측면에서 보면 우리는 시스템의 안정성을 중요하게 생각하는데, 언제 시스템이 잘 동작하는지 이해해야 시스템에 문제가 생겼을 때 이를 판단할 수 있고 상술한 역동성을 유지할 수 있는지 적절한 수준의 자동 및 수동 제어를 구현할 수 있다.
- 그림 7.1은 시스템을 거쳐가는 요청의 동작에 영향을 미치는 위치에 이스티오의 데이터 플레인이 있음을 보여준다.
- 이스티오는 트래픽 전환, 복원력, 정책 강제 등 제어를 구현하는 데 도움이 될 수 있다.
- 그러나 어떤 제어를 언제 사용해야 할지 알기 위해서는 시스템에서 어떤 일이 일어나고 있는지 이해해야 한다.
- 이스티오의 제어 기능 대부분이 애플리케이션 요청의 네트워크 수준에서 구현되므로, 관찰 결과를 알리기 위해 메트릭을 수집하는 이스티오의 기능도 이 수준에 있다는 것은 그리 놀라운 일이 아니다.
- 그렇다고 해서 이스티오를 사용해 관찰 가능성을 보조하기만 하면 시스템에 관찰 가능성을 들여올 수 있다는 의미는 아니다.

- 관찰 가능성이란 특성 기성 솔루션을 말하는 것이 아니라 다양한 수준을 포함하는 시스템의 특성을 말한다.
- 또한 관찰 가능성은 애플리케이션 계측, 네트워크 계측, 시그널 수집 인프라, 데이터베이스뿐 아니라 예기치 못한 일이 일어났을 때 방대한 데이터를 잘 추리고 결합해 전체 그림을 그려내는 방법도 포함해야 한다. (다양한 레벨 계측 필요)
- 이스티오는 관찰 가능성의 한 부분인 애플리케이션 수준 네트워크 계측을 보조한다.
7.1.1 Observability 관찰가능성 (휠씬 더 많은 데이터 수집) vs. monitoring 모니터링
- 관찰 가능성이란 용어는 이미 익숙할 수 있는 관행인 모니터링과 관련해 시장에 혼란을 가져왔다.
- 모니터링이란 메트릭, 로그, 트레이스 등을 수집 및 집계하고, 신중하게 지켜봐야 하는 시스템 상태를 미리 정의한 기준과 비교하는 관행을 말한다.
- 메트릭 중 하나가 임계값을 넘겨 불량 상태로 향하고 있다면, 우리는 시스템을 바로잡기 위한 조치를 취한다.
- 예를 들어 운영 팀은 특정 데이트베이스 인스턴스의 디스크 사용량 정보를 집계할 수 있다.
- 이 메트릭에서 디스크 사용량이 디스크 용량에 가까워지면 디스크에 공간을 추가하는 등 조치를 시작하도록 정보를 울릴 수 있다.
- 모니터링은 관찰 가능성의 부분집합이다.
- 모니터링은 바람직하지 않다고 알려진 상태를 감시하고 경고하고자, 특히 메트릭을 수집하고 집계하고 있다.
- 반면에 관찰 가능성은 시스템을 예측하기 매우 어려운 것으로 보기에 일어날 수 있는 모든 고장을 사전에 알 수는 없다고 가정한다.
- 우리는 휠씬 더 많은 데이터, 전체 집합이 기하급수적으로 클 수 있는 사용자 ID, 요청 ID, 소스 IP등 카디널리티가 높은 데이터까지도 수집하고, 도구를 사용해 데이터를 빠르게 탐색하고 질문해야 한다.
- 예를 들어 사용자 ID가 400000021인 특정 사용자 홍길동이 장바구니의 물건을 계산하려 하는데, 지불 옵션을 고를 때 10초의 지연 시간을 겪었다고 해보자.
- 미리 정의해둔 메트릭 임계값(디스크 사용량, 대기열 깊이, 머신 상태 등)은 모두 허용 가능한 수준일 수 있지만, 홍길동은 이와 같은 경험에 무척 짜증이 난다.
- 만약 관찰 가능성을 염두에 두고 설계했다면, 서비스의 여러 계층을 살펴보고 시스템에서 요청이 거쳤을 정확한 경로를 확인할 수 있다.
7.1.2 How Istio helps with observability 이스티오가 어떻게 관찰 가능성을 돕는가?
- 이스티오는 관찰 가능한 시스템을 구축하는 데 도움을 줄 수 있는 독특한 위치에 있다.
- 이스티오의 데이터 플레인 프록시, 엔보이가 서비스 간 네트워크 요청 경로에 자리하고 있기 때문이다.
- 이스티오는 엔보이 서비스 프록시를 통해 요청 처리와 서비스 상호작용에 관련된 중요 메트릭을 포착할 수 있는데, 이를테면 초당 요청 수, 요청 처리에 걸리는 시간(백분위수로 구분), 실패한 요청 수 등이 있다.
- 또한 이스티오는 시스템에 새 메트릭을 동적으로 추가할 수 있으므로, 미처 생각하지 못했던 새로운 정보를 포착하는 데 도움이 될 수도 있다.
- 분산 시스템을 이해하는 또 다른 측면은 시스템을 거치는 요청을 추적해 어떤 서비스 및 구성 요소가 요청 흐름에 포함되는지, 그래프 내 각 노드가 요청을 처리하는 데 얼마나 걸리는지를 이해하는 것이다. 다음 장에서는 분산 트레이싱을 다룬다.
- 마지막으로 이스티오에는 프로메테우스, 그라파나, 키알리 등과 같은 기본 샘플 도구가 포함돼 있어 서비스 메시와 서비스 메시가 알고 있는 서비스의 상태를 시각화하고 탐색하는 데 도움이 된다.
- 우리는 기본 샘플 프로메테우스, 그라파나, 키알리를 사용하지 않을 것이다. (2장에서 설치했던 추가 기능으로서 데모용이다)
- 이번 장과 다음 장에서는 좀 더 현실적인 설정을 사용한다.
- 2장에서 설치한 샘플 도구를 삭제한다. → 실습 환경에서 미설치로 대체
7.2 Exploring Istio metrics 이스티오 메트릭 살펴보기 (실습)
- 이스티오의 데이터 플레인은 요청을 처리하고, 컨트롤 플레인은 데이터 플레인이 요청을 처리하도록 설정한다.
- 둘 다 메트릭이 아주 방대하므로, 애플리케이션 네트워크와 메시의 운영 측면에서 런타임에 어떤 일이 있는지 데이터 플레인과 컨트롤 플레인에서 사용할 수 있는 메트릭을 자세히 살펴보자.
7.2.1 Metrics in the data plane 데이터 플레인의 메트릭 - 엔보이 표준/상세 메트릭 설정 및 확인
- 엔보이는 커넥션, 요청, 런타임 메트릭을 다양하게 갖추고 있으며, 이들을 사용해 서비스의 네트워크 및 통신 상태를 파악할 수 있다.
- 먼저 예제 애플리케이션의 부분집합을 배포하고, 그 구성 요소를 탐색해 이들 메트릭이 어디서 오는지, 메트릭에 어떻게 접근할 수 있는지를 이해해보자.
- 애플리케이션 네트워킹 관련 메트릭을 수집한 후 탐색하고 시각화할 수 있는 영역으로 가져와 관찰할 수 있는 시스템을 구축하는 이스티오의 기능을 살펴볼 것이다.
초기화 및 실습 환경 구성
# istioinaction 네임스페이스 초기화
kubectl delete -n istioinaction deploy,svc,gw,vs,dr,envoyfilter --all

# catalog 앱 기동
kubectl apply -f services/catalog/kubernetes/catalog.yaml -n istioinaction

# webapp 앱 기동
kubectl apply -f services/webapp/kubernetes/webapp.yaml -n istioinaction

# gateway, virtualservice 설정
kubectl apply -f services/webapp/istio/webapp-catalog-gw-vs.yaml -n istioinaction

# 확인
kubectl get deploy,pod,svc,ep,gw,vs -n istioinaction

# 호출테스트
curl -s http://webapp.istioinaction.io:30000
curl -s http://webapp.istioinaction.io:30000/api/catalog | jq
curl -s http://webapp.istioinaction.io:30000/api/catalog | jq
...
서비스의 사이드카 프록시가 유지하는 메트릭 확인
#
kubectl get pod -n istioinaction
NAME                     READY   STATUS    RESTARTS   AGE
catalog-6cf4b97d-wlwk4   2/2     Running   0          3m54s
webapp-7685bcb84-4s9wk   2/2     Running   0          3m51s

docker exec -it myk8s-control-plane istioctl proxy-status
NAME                                                  CLUSTER        CDS        LDS        EDS        RDS        ECDS         ISTIOD                      VERSION
catalog-6cf4b97d-wlwk4.istioinaction                  Kubernetes     SYNCED     SYNCED     SYNCED     SYNCED     NOT SENT     istiod-7df6ffc78d-4vsnj     1.17.8
webapp-7685bcb84-4s9wk.istioinaction                  Kubernetes     SYNCED     SYNCED     SYNCED     SYNCED     NOT SENT     istiod-7df6ffc78d-4vsnj     1.17.8
...

# 쿼리를 실행해 파드의 통계 확인 : 정보가 많음. 프록시가 보관하는 정보는 휠씬 더 많지만, 대부분은 기본적으로 제거됨.
kubectl exec -it deploy/catalog -c istio-proxy -n istioinaction -- curl localhost:15000/stats
kubectl exec -it deploy/webapp  -c istio-proxy -n istioinaction -- curl localhost:15000/stats
...
destination_version=.=unknown;.;destination_service=.
=webapp.istioinaction.svc.cluster.local;.;destination_service_name=.
=webapp;.;destination_service_namespace=.=istioinaction;.;
destination_canonical_service=.=webapp;
.;destination_canonical_revision=.
=latest;.;request_protocol=.=http;.;response_flags=.=-;.
;connection_security_policy=.=mutual_tls;.;response_code=.=200;.
;grpc_response_status=.=;.;destination_cluster=.=Kubernetes;.
;source_cluster=.=Kubernetes;.;istio_requests_total: 2
...
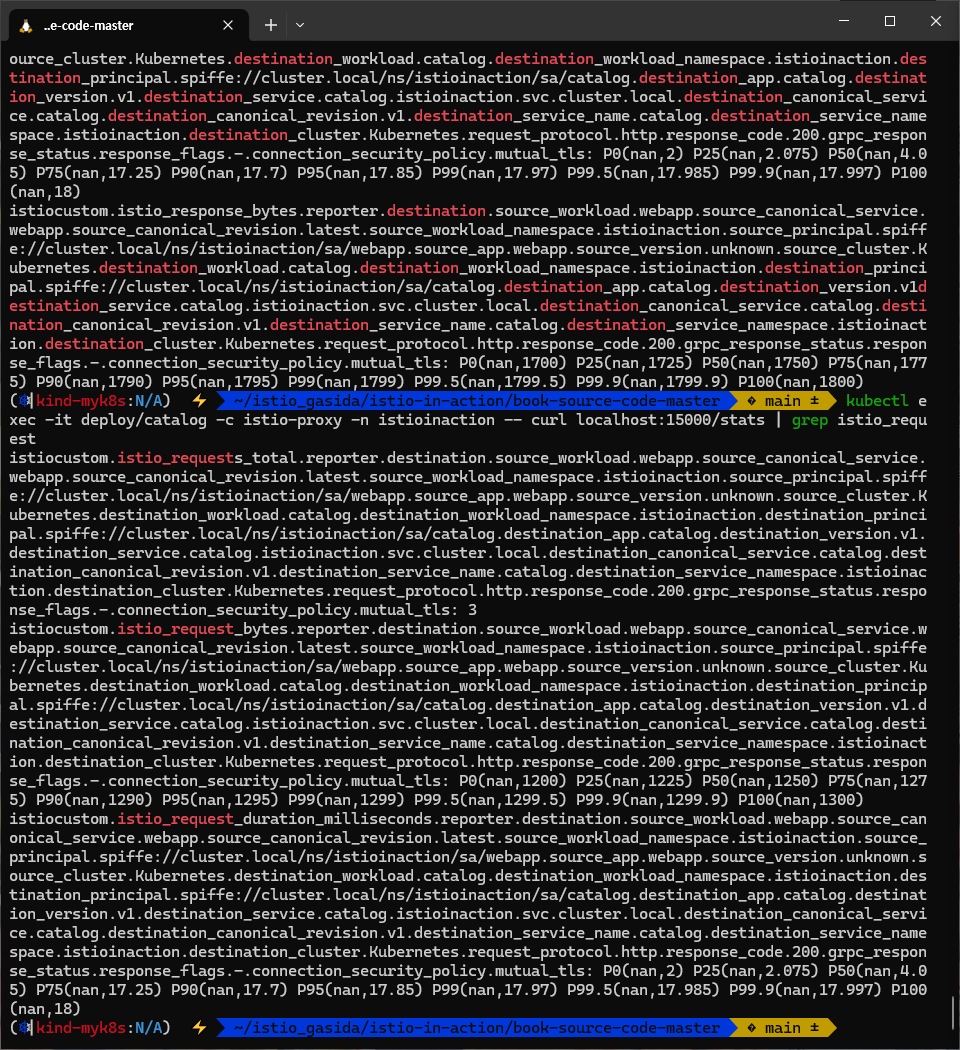

- 여기서 가장 중요한 부분은 마지막 istio_request_total 이다.
- 나머지 부분을 읽으면, 이것이 인그레스 게이트웨이에서 webapp 서비스로 들어오는 요청에 대한 메트릭이며 그 요청이 총 2개임을 알 수 있다.
- 이 메트릭이 보이지 않으면 서비스를 몇 번 더 호출해보자.
- 다음 히스토그램은 각 프록시가 인바운드 및 아웃바운드 호출에 유지하는 표준 이스티오 메트릭이다. - Docs
- istio_requests_total : This is a COUNTER incremented for every request handled by an Istio proxy.
- istio_request_bytes : This is a DISTRIBUTION which measures HTTP request body sizes
- istio_response_bytes : This is a DISTRIBUTION which measures HTTP response body sizes.
- istio_request_duration_milliseconds : This is a DISTRIBUTION which measures the duration of requests.
- ⇒ The telemetry component is implemented as a Proxy-wasm plugin.
- 이들 덕분에 메트릭 수집에 대해 따로 무엇을 하지 않아도 정보가 풍부하다.
(참고) 최소한의 종속성만 포한하는 distroless 이미지 집합은 curl 미포함으로 pilot-agent 에 쿼리할 수 있는 최소한의 cli 방법 사용 가능 - Docs
# Follow the Installation Steps to set up Istio. Add the variant option to use the distroless images.
istioctl install --set values.global.variant=distroless

# pilot-agent request
kubectl exec -it deploy/webapp -c istio-proxy -n istioinaction -- pilot-agent request GET help
kubectl exec -it deploy/webapp -c istio-proxy -n istioinaction -- pilot-agent request GET /stats
kubectl exec -it deploy/webapp -c istio-proxy -n istioinaction -- pilot-agent request GET /stats/prometheus
kubectl exec -it deploy/webapp -c istio-proxy -n istioinaction -- pilot-agent request GET /listeners
kubectl exec -it deploy/webapp -c istio-proxy -n istioinaction -- pilot-agent request GET /clusters
...

# Debugging
$ kubectl debug --image istio/base --target istio-proxy -it app-65c6749c9d-t549t
Defaulting debug container name to debugger-cdftc.
If you don't see a command prompt, try pressing enter.
root@app-65c6749c9d-t549t:/# curl example.com
프록시가 엔보이 통계를 더 많이 보고하도록 설정하기 CONFIGURING PROXIES TO REPORT MORE ENVOY STATISTICS
- 가끔 네트워크 동작을 트러블슈팅하려면 표준 이스티오 메트릭보다 더 많은 정보를 확인해야 할 때가 있다.
- 앞 장들에서 이렇게 다른 메트릭을 활성화하는 방법을 살짝 언급했는데, 이제 자세히 살펴보자.
- 애플리케이션 호출이 자신의 클라이언트 측 프록시를 거쳐갈 때, 프록시는 라우팅 결정을 내리고 업스트릠 클러스터로 라우팅한다.
- 업스트림 클러스터란 관련 설정(로드 밸런싱, 보안, 서킷 브레이커 설정 등)을 적용해 실제 호출되는 서비스를 말한다.
- 이 예제에서는 webapp 서비스가 catalog 서비스로 라우팅된다.
- 업스트림 catalog 서비스 호출에 추가 정보를 활성해화보자.
방법 1 (IstioOperator 명세) : 메시 전체에 적용 - Docs
apiVersion: install.istio.io/v1alpha1
kind: IstioOperator
metadata:
  name: control-plane
spec:
  profile: demo
  meshConfig:
    defaultConfig: # Defines the default proxy configuration for all services
      proxyStatsMatcher: # Customizes the reported metrics
        inclusionPrefixes: # Metrics matching the prefix will be reported alongside the default ones.
- "cluster.outbound|80||catalog.istioinaction"메시 전체에 수집하는 메트릭을 늘리면 메트릭 수집 시스템을 과부하 상태로 만들 수 있으므로 아주 신중하게 적용해야 한다.
방법 2 (해당 워크로드 별 명세) : 워크로드 단위로 설정(애노테이션으로 포함할 메트릭 지정) ← 권장 방법
# cat ch7/webapp-deployment-stats-inclusion.yaml
...
  template:
    metadata:
      annotations:
        proxy.istio.io/config: |-
          proxyStatsMatcher:
            inclusionPrefixes:
            - "cluster.outbound|80||catalog.istioinaction"
      labels:
app: webapp# 호출테스트
curl -s http://webapp.istioinaction.io:30000/api/catalog | jq
# 적용 전 확인
kubectl exec -it deploy/webapp -c istio-proxy -n istioinaction -- curl localhost:15000/stats | grep catalog
# 적용
cat ch7/webapp-deployment-stats-inclusion.yaml
kubectl apply -n istioinaction -f ch7/webapp-deployment-stats-inclusion.yaml
# 호출테스트
curl -s http://webapp.istioinaction.io:30000/api/catalog | jq
curl -s http://webapp.istioinaction.io:30000/api/catalog | jq
# 적용 후 확인 : catalog.istioinaction 에 대한 metrics 추가
# upstream 클러스터로 향햐는 커넥션 혹은 요청 시 circuit breaking 작동 확인
kubectl exec -it deploy/webapp -c istio-proxy -n istioinaction -- curl localhost:15000/stats | grep catalog
...
cluster.outbound|80||catalog.istioinaction.svc.cluster.local.upstream_cx_active: 2
cluster.outbound|80||catalog.istioinaction.svc.cluster.local.upstream_cx_close_notify: 0
cluster.outbound|80||catalog.istioinaction.svc.cluster.local.upstream_cx_connect_attempts_exceeded: 0
...
cluster.outbound|80||catalog.istioinaction.svc.cluster.local.upstream_rq_200: 2
cluster.outbound|80||catalog.istioinaction.svc.cluster.local.upstream_rq_2xx: 2
cluster.outbound|80||catalog.istioinaction.svc.cluster.local.upstream_rq_active: 0
...


- 엔보이는 트래픽을 식별 할 때 출처가 내부인지 외부인지를 구분한다.
- 내부는 보통 메시 내부 트래픽이라 인식하는 것을 말하고, 외부는 메시 외부에서 시작한 트래픽(인그레스 게이트웨이로 들어온 트래픽)을 말한다.
# cluster_name.internal.*. 메트릭을 보면 메시 내부에서 시작해 성공한 요청 개수를 확인 할 수 있다.
kubectl exec -it deploy/webapp -c istio-proxy -n istioinaction -- curl localhost:15000/stats | grep catalog | grep internal
...
cluster.outbound|80||catalog.istioinaction.svc.cluster.local.internal.upstream_rq_200: 2
cluster.outbound|80||catalog.istioinaction.svc.cluster.local.internal.upstream_rq_2xx: 2
cluster.outbound|80||catalog.istioinaction.svc.cluster.local.internal.upstream_rq_completed: 2
...
cluster_name.ssl.* 메트릭은 트래픽이 TLS로 업스트림 클러스터로 이동하는지 여부와 커넥션과 관련된 기타 세부 정보(cipher, curve 등)을 알아내는 데 매우 유용하다.
# cluster_name.internal.*. 메트릭을 보면 메시 내부에서 시작해 성공한 요청 개수를 확인 할 수 있다.
kubectl exec -it deploy/webapp -c istio-proxy -n istioinaction -- curl localhost:15000/stats | grep catalog | grep ssl
...
cluster.outbound|80||catalog.istioinaction.svc.cluster.local.ssl.ciphers.TLS_AES_128_GCM_SHA256: 2
cluster.outbound|80||catalog.istioinaction.svc.cluster.local.ssl.connection_error: 0
cluster.outbound|80||catalog.istioinaction.svc.cluster.local.ssl.curves.X25519: 2
cluster.outbound|80||catalog.istioinaction.svc.cluster.local.ssl.fail_verify_cert_hash: 0
cluster.outbound|80||catalog.istioinaction.svc.cluster.local.ssl.fail_verify_error: 0
cluster.outbound|80||catalog.istioinaction.svc.cluster.local.ssl.fail_verify_no_cert: 0
cluster.outbound|80||catalog.istioinaction.svc.cluster.local.ssl.fail_verify_san: 0
cluster.outbound|80||catalog.istioinaction.svc.cluster.local.ssl.handshake: 2
cluster.outbound|80||catalog.istioinaction.svc.cluster.local.ssl.versions.TLSv1.3: 2
...
upstream_cx와 upstream_rq는 네트워크에서 일어나는 일에 대한 좀 더 정확한 정보를 제공한다.
# 업스트림 커넥션 및 요청에 대한 메트릭
kubectl exec -it deploy/webapp -c istio-proxy -n istioinaction -- curl localhost:15000/stats | grep catalog | egrep 'local.upstream_cx|local.upstream_rq'
...
cluster.outbound|80||catalog.istioinaction.svc.cluster.local.upstream_cx_active: 2
cluster.outbound|80||catalog.istioinaction.svc.cluster.local.upstream_cx_close_notify: 0
cluster.outbound|80||catalog.istioinaction.svc.cluster.local.upstream_cx_connect_attempts_exceeded: 0
...
cluster.outbound|80||catalog.istioinaction.svc.cluster.local.upstream_rq_timeout: 0
cluster.outbound|80||catalog.istioinaction.svc.cluster.local.upstream_rq_total: 2
cluster.outbound|80||catalog.istioinaction.svc.cluster.local.upstream_rq_tx_reset: 0
기타 업스트림 클러스터용 메트릭은 엔보이 문서를 참고 - Docs
# lb 정보
kubectl exec -it deploy/webapp -c istio-proxy -n istioinaction -- curl localhost:15000/stats | grep catalog | grep lb
...
cluster.outbound|80||catalog.istioinaction.svc.cluster.local.lb_healthy_panic: 0
cluster.outbound|80||catalog.istioinaction.svc.cluster.local.lb_local_cluster_not_ok: 0
cluster.outbound|80||catalog.istioinaction.svc.cluster.local.lb_recalculate_zone_structures: 0
cluster.outbound|80||catalog.istioinaction.svc.cluster.local.lb_subsets_active: 0
...
프록시가 알고 있는 모든 백엔드 클러스터에 대한 정보와 그들의 엔드포인트를 나열하도록 다른 쿼리를 해보자.
#
kubectl exec -it deploy/webapp -c istio-proxy -n istioinaction -- curl localhost:15000/clusters
kubectl exec -it deploy/webapp -c istio-proxy -n istioinaction -- curl localhost:15000/clusters | grep catalog
...
outbound|80||catalog.istioinaction.svc.cluster.local::default_priority::max_connections::4294967295
outbound|80||catalog.istioinaction.svc.cluster.local::default_priority::max_pending_requests::4294967295
outbound|80||catalog.istioinaction.svc.cluster.local::default_priority::max_requests::4294967295
outbound|80||catalog.istioinaction.svc.cluster.local::default_priority::max_retries::4294967295
outbound|80||catalog.istioinaction.svc.cluster.local::high_priority::max_connections::1024
outbound|80||catalog.istioinaction.svc.cluster.local::high_priority::max_pending_requests::1024
outbound|80||catalog.istioinaction.svc.cluster.local::high_priority::max_requests::1024
outbound|80||catalog.istioinaction.svc.cluster.local::high_priority::max_retries::3
outbound|80||catalog.istioinaction.svc.cluster.local::added_via_api::true
outbound|80||catalog.istioinaction.svc.cluster.local::eds_service_name::outbound|80||catalog.istioinaction.svc.cluster.local
outbound|80||catalog.istioinaction.svc.cluster.local::10.10.0.10:3000::cx_active::2
outbound|80||catalog.istioinaction.svc.cluster.local::10.10.0.10:3000::cx_connect_fail::0
outbound|80||catalog.istioinaction.svc.cluster.local::10.10.0.10:3000::cx_total::2
outbound|80||catalog.istioinaction.svc.cluster.local::10.10.0.10:3000::rq_active::0
outbound|80||catalog.istioinaction.svc.cluster.local::10.10.0.10:3000::rq_error::0
outbound|80||catalog.istioinaction.svc.cluster.local::10.10.0.10:3000::rq_success::2
outbound|80||catalog.istioinaction.svc.cluster.local::10.10.0.10:3000::rq_timeout::0
outbound|80||catalog.istioinaction.svc.cluster.local::10.10.0.10:3000::rq_total::2
outbound|80||catalog.istioinaction.svc.cluster.local::10.10.0.10:3000::hostname::
outbound|80||catalog.istioinaction.svc.cluster.local::10.10.0.10:3000::health_flags::healthy
outbound|80||catalog.istioinaction.svc.cluster.local::10.10.0.10:3000::weight::1
outbound|80||catalog.istioinaction.svc.cluster.local::10.10.0.10:3000::region::
outbound|80||catalog.istioinaction.svc.cluster.local::10.10.0.10:3000::zone::
outbound|80||catalog.istioinaction.svc.cluster.local::10.10.0.10:3000::sub_zone::
outbound|80||catalog.istioinaction.svc.cluster.local::10.10.0.10:3000::canary::false
outbound|80||catalog.istioinaction.svc.cluster.local::10.10.0.10:3000::priority::0
outbound|80||catalog.istioinaction.svc.cluster.local::10.10.0.10:3000::success_rate::-1
outbound|80||catalog.istioinaction.svc.cluster.local::10.10.0.10:3000::local_origin_success_rate::-1- 이 출력에서는 특정 업스트림 클러스터에 대한 자세한 정보를 볼 수 있다.
- 이 클러스터에는 어떤 엔드포인트(이 경우 10.10.0.10)가 있는지, 해당 엔드포인트가 속한 리전, 영역, 하위 영역은 어디인지, 해당 엔드포인트에 활성 요청 또는 오류가 있는지 등의 정보가 포함된다.
- 앞 선 통계 집합은 클러스터 전체 정보였는데, 이 통계 집합에서는 엔드포인트별로 자세한 정보를 볼 수 있다.
- 프록시는 메트릭을 잘 수집하고 있지만, 이것을 보자고 각 서비스 인스턴스와 프록시로 가고 싶지는 않다.
- 이스티오 프록시는 프로메테우스나 데이터독 같은 메트릭 수집 시스템으로 긁어 갈 수 있다.
- 다음 절에서는 프로메테우스를 설정하는 방법을 다룰 것이다.
- 그 에 앞서 컨트롤 플레인에서는 어떤 메트릭을 사용할 수 있는지 살펴보자.
7.2.2 Metrics in the control plane 컨트롤 플레인의 메트릭 - citadel, pilot, xds 메트릭 확인
- 컨트롤 플레인 istiod 에는 어떻게 동작하는지에 대한 정보가 풍부하다.
- 이를테면 다양한 데이터 플레인 프록시와 설정을 동기화한 횟수, 설정 동기화에 소요된 시간이나 잘못된 설정, 인증서 발급/로테이션에 대한 정보 등이 있다.
- 이 메트릭들은 11장에서 컨트롤 플레인 성능 튜닝을 살펴 볼 때 더 자세히 다룰 것이다.
# istiod 파드에 tcp LISTEN port 정보 확인
kubectl exec -it deploy/istiod -n istio-system -- netstat -tnl
Active Internet connections (only servers)
Proto Recv-Q Send-Q Local Address           Foreign Address         State
tcp        0      0 127.0.0.1:9876          0.0.0.0:*               LISTEN
tcp6       0      0 :::8080                 :::*                    LISTEN
tcp6       0      0 :::15017                :::*                    LISTEN
tcp6       0      0 :::15010                :::*                    LISTEN
tcp6       0      0 :::15012                :::*                    LISTEN
tcp6       0      0 :::15014                :::*                    LISTEN

# 다음 명령어를 실행해 컨트롤 플레인 메트릭을 보자
## CSR : Certificate Signing Request 인증서 발급 요청
## Citadel : Istio 보안 컴포넌트
kubectl exec -it -n istio-system deploy/istiod -n istio-system -- curl localhost:15014/metrics
kubectl exec -it -n istio-system deploy/istiod -n istio-system -- curl localhost:15014/metrics | grep citadel
# HELP citadel_server_csr_count The number of CSRs received by Citadel server.
# TYPE citadel_server_csr_count counter
citadel_server_csr_count 4
# HELP citadel_server_root_cert_expiry_timestamp The unix timestamp, in seconds, when Citadel root cert will expire. A negative time indicates the cert is expired.
# TYPE citadel_server_root_cert_expiry_timestamp gauge
citadel_server_root_cert_expiry_timestamp 2.060988622e+09
# HELP citadel_server_success_cert_issuance_count The number of certificates issuances that have succeeded.
# TYPE citadel_server_success_cert_issuance_count counter
citadel_server_success_cert_issuance_count 4

# 컨트롤 플레인 버전에 대한 런타임 정보 확인 : istio 버전정보
kubectl exec -it -n istio-system deploy/istiod -n istio-system -- curl localhost:15014/metrics | grep istio_build
istio_build{component="pilot",tag="1.17.8"} 1

- 설정을 데이터 플레인 프록시에 밀어넣고 동기화하는 데 소용되는 시간의 분포를 보여준다.
- 여기서는 설정 수렴 이벤트 25개 중 24개가 0.1초 이하의 시간이 걸렸으며(le=’0.1’ 로 표시), 하나만 0.1초보다 더 걸렸다(le는 ‘이하’를 의미)
#
kubectl exec -it -n istio-system deploy/istiod -n istio-system -- curl localhost:15014/metrics | grep convergence
# HELP pilot_proxy_convergence_time Delay in seconds between config change and a proxy receiving all required configuration.
# TYPE pilot_proxy_convergence_time histogram
pilot_proxy_convergence_time_bucket{le="0.1"} 24 # 0.1초 내에 24개의 업데이트가 프록시에 배포됐다
pilot_proxy_convergence_time_bucket{le="0.5"} 25 # 요청 하나는 좀 더 걸려서 0.1~0.5초 범위에 속했다
pilot_proxy_convergence_time_bucket{le="1"} 25
pilot_proxy_convergence_time_bucket{le="3"} 25
pilot_proxy_convergence_time_bucket{le="5"} 25
pilot_proxy_convergence_time_bucket{le="10"} 25
pilot_proxy_convergence_time_bucket{le="20"} 25
pilot_proxy_convergence_time_bucket{le="30"} 25
pilot_proxy_convergence_time_bucket{le="+Inf"} 25
pilot_proxy_convergence_time_sum 0.020836250000000004
pilot_proxy_convergence_time_count 25이 부분은 컨트롤 플레인에 알려진 서비스 개수, 사용자가 설정한 VirtualService 리소스 개수, 연결된 프록시 개수를 보여준다.
#
kubectl exec -it -n istio-system deploy/istiod -n istio-system -- curl localhost:15014/metrics | grep pilot | egrep 'service|^pilot_xds'
...
# HELP pilot_services Total services known to pilot.
# TYPE pilot_services gauge
pilot_services 8 # 컨트롤플레인에서 알고있는 서비스개수 kubectl get svc -A -oname | wc -l
# HELP pilot_virt_services Total virtual services known to pilot.
# TYPE pilot_virt_services gauge
pilot_virt_services 1 # 유저가 설정한 VirtualService 개수 kubectl get vs -A -oname | wc -l
# HELP pilot_vservice_dup_domain Virtual services with dup domains.
# TYPE pilot_vservice_dup_domain gauge
pilot_vservice_dup_domain 0
pilot_xds{version="1.17.8"} 3 # 연결된 프록시 개수 docker exec -it myk8s-control-plane istioctl proxy-status- 마지막 부분은 특정 xDS API의 업데이트 횟수를 보여준다.
- 앞서 3장에서는 CDS, EDS, LDS/RDS, SDS 등의 영역에 엔보이 설정을 동적으로 업데이트 하는 방법을 다뤘다.
- 11장에서는 이스티오 컨트롤 플레인의 성능 튜닝을 살펴볼 때 더 많은 컨트롤 플레인 메트릭을 다룬다.
- 지금까지 데이터 플레인과 컨트롤 플레인이 내부에서 일어나는 일을 얼마나 자세히 보고하는지를 설명했다.
- 이런 세부 사항을 노출하는 것은 관찰 가능한 시스템을 구축하는 데 중요하다.
- 그런데 서비스 메시 구성 요소가 이 정보를 노출한다고 해도 메시의 운영자나 사용자는 이 메트릭을 어떻게 활용할지를 고민해봐야 한다.
- 이 메트릭들을 얻자고 데이터 플레인이나 컨트롤 플레인의 각 구성 요소에 일일이 접근하는 것은 비현실적이다.
- 그러므로 메트릭 수집과 시계열 데이터베이스 시스템을 어떻게 사용하면 이 과정을 자동화하고 데이터를 쓸 만한 방식으로 표시할 수 있을지 살펴보자.
7.3 Scraping Istio metrics with Prometheus (실습)
들어가며 : 프로메테우스, 메트릭 엔드포인트
- 프로메테우스는 사운드클라우드에서 시작된 메트릭 수집 엔진이자 관련 모니터링 및 얼럿 alert 도구 집합이며, 구글의 내부 모니터링 시스템 Borgmon 에 어느 정도 기반을 두고 있다 (쿠버네티스가 Borg에 기반을 둔 것과 비슷하게).
- 프로메테우스는 다른 텔레메트릭 혹은 메트릭 수집 시스템과 조금 다른데, 에이전트가 메트릭을 ‘밀어넣기 push’를 기대하기보다 메트릭을 ‘당겨오기 pull’ 때문이다.
- 프로메테우스를 사용하면, 우리의 애플리케이션 또는 이스티오 서비스 프록시가 최신 메트릭을 포함하는 엔드포인트를 제공하고 프로메테우스가 그 정보를 끌어오거나 긁어올 수 있도록 핟나.
- 이 책에서 당겨오기나 밀어넣기 방식 중 어느 메트릭 수집 방식이 더 나은지는 논쟁하지 않지만, 둘 다 존재하면 조직이 두 가지 중 하나(또는 두 가지 모두)를 선택할 수 있다는 사실은 인정할 것이다.
- 브라이언 브라질 Brian Brazil의 팟캐스트 는 pull 기반 메트릭이 push 기반 시스템과 어떻게 다르고 프로메테우스가 pull 기반 메트릭을 어떻게 접근하는지를 자세히 설명한다. https://thenewstack.io/exploring-prometheus-use-cases-brian-brazil/
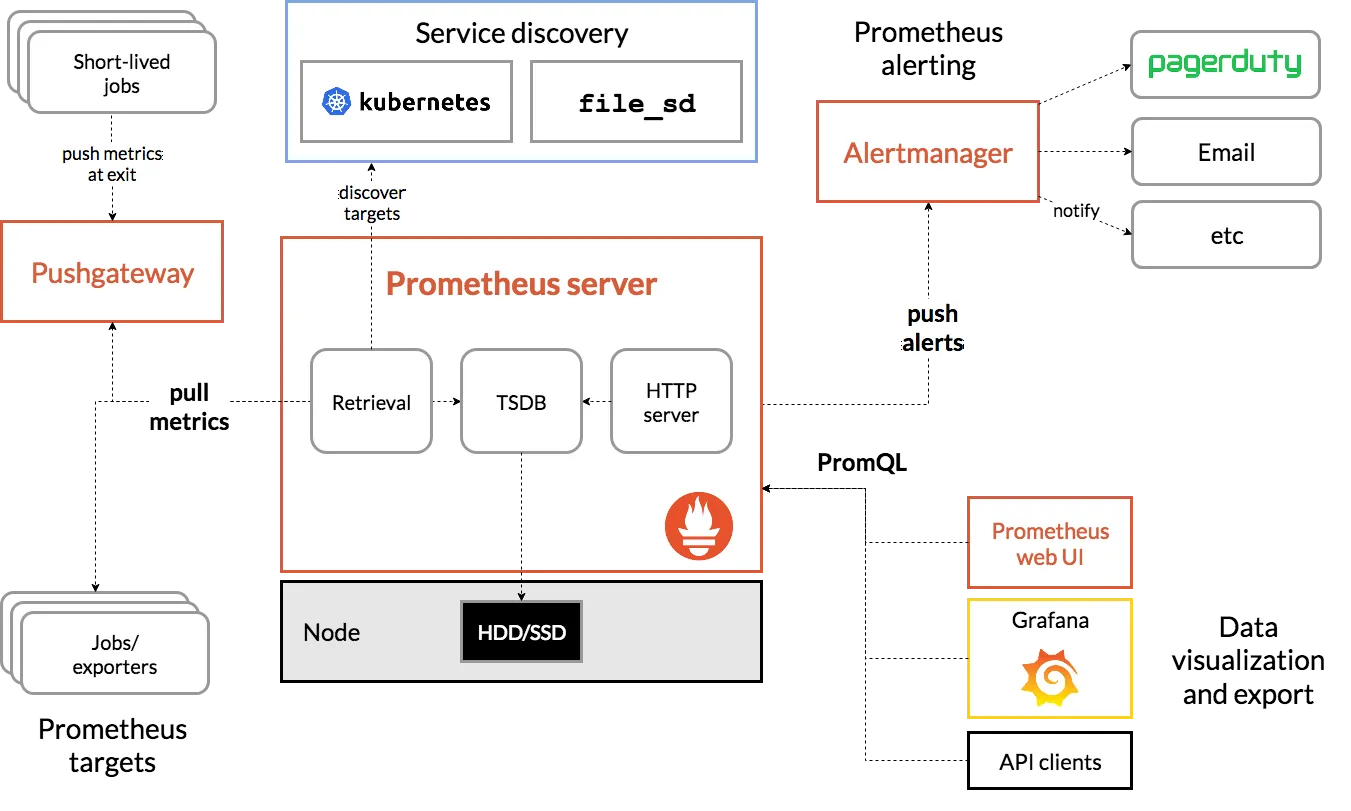
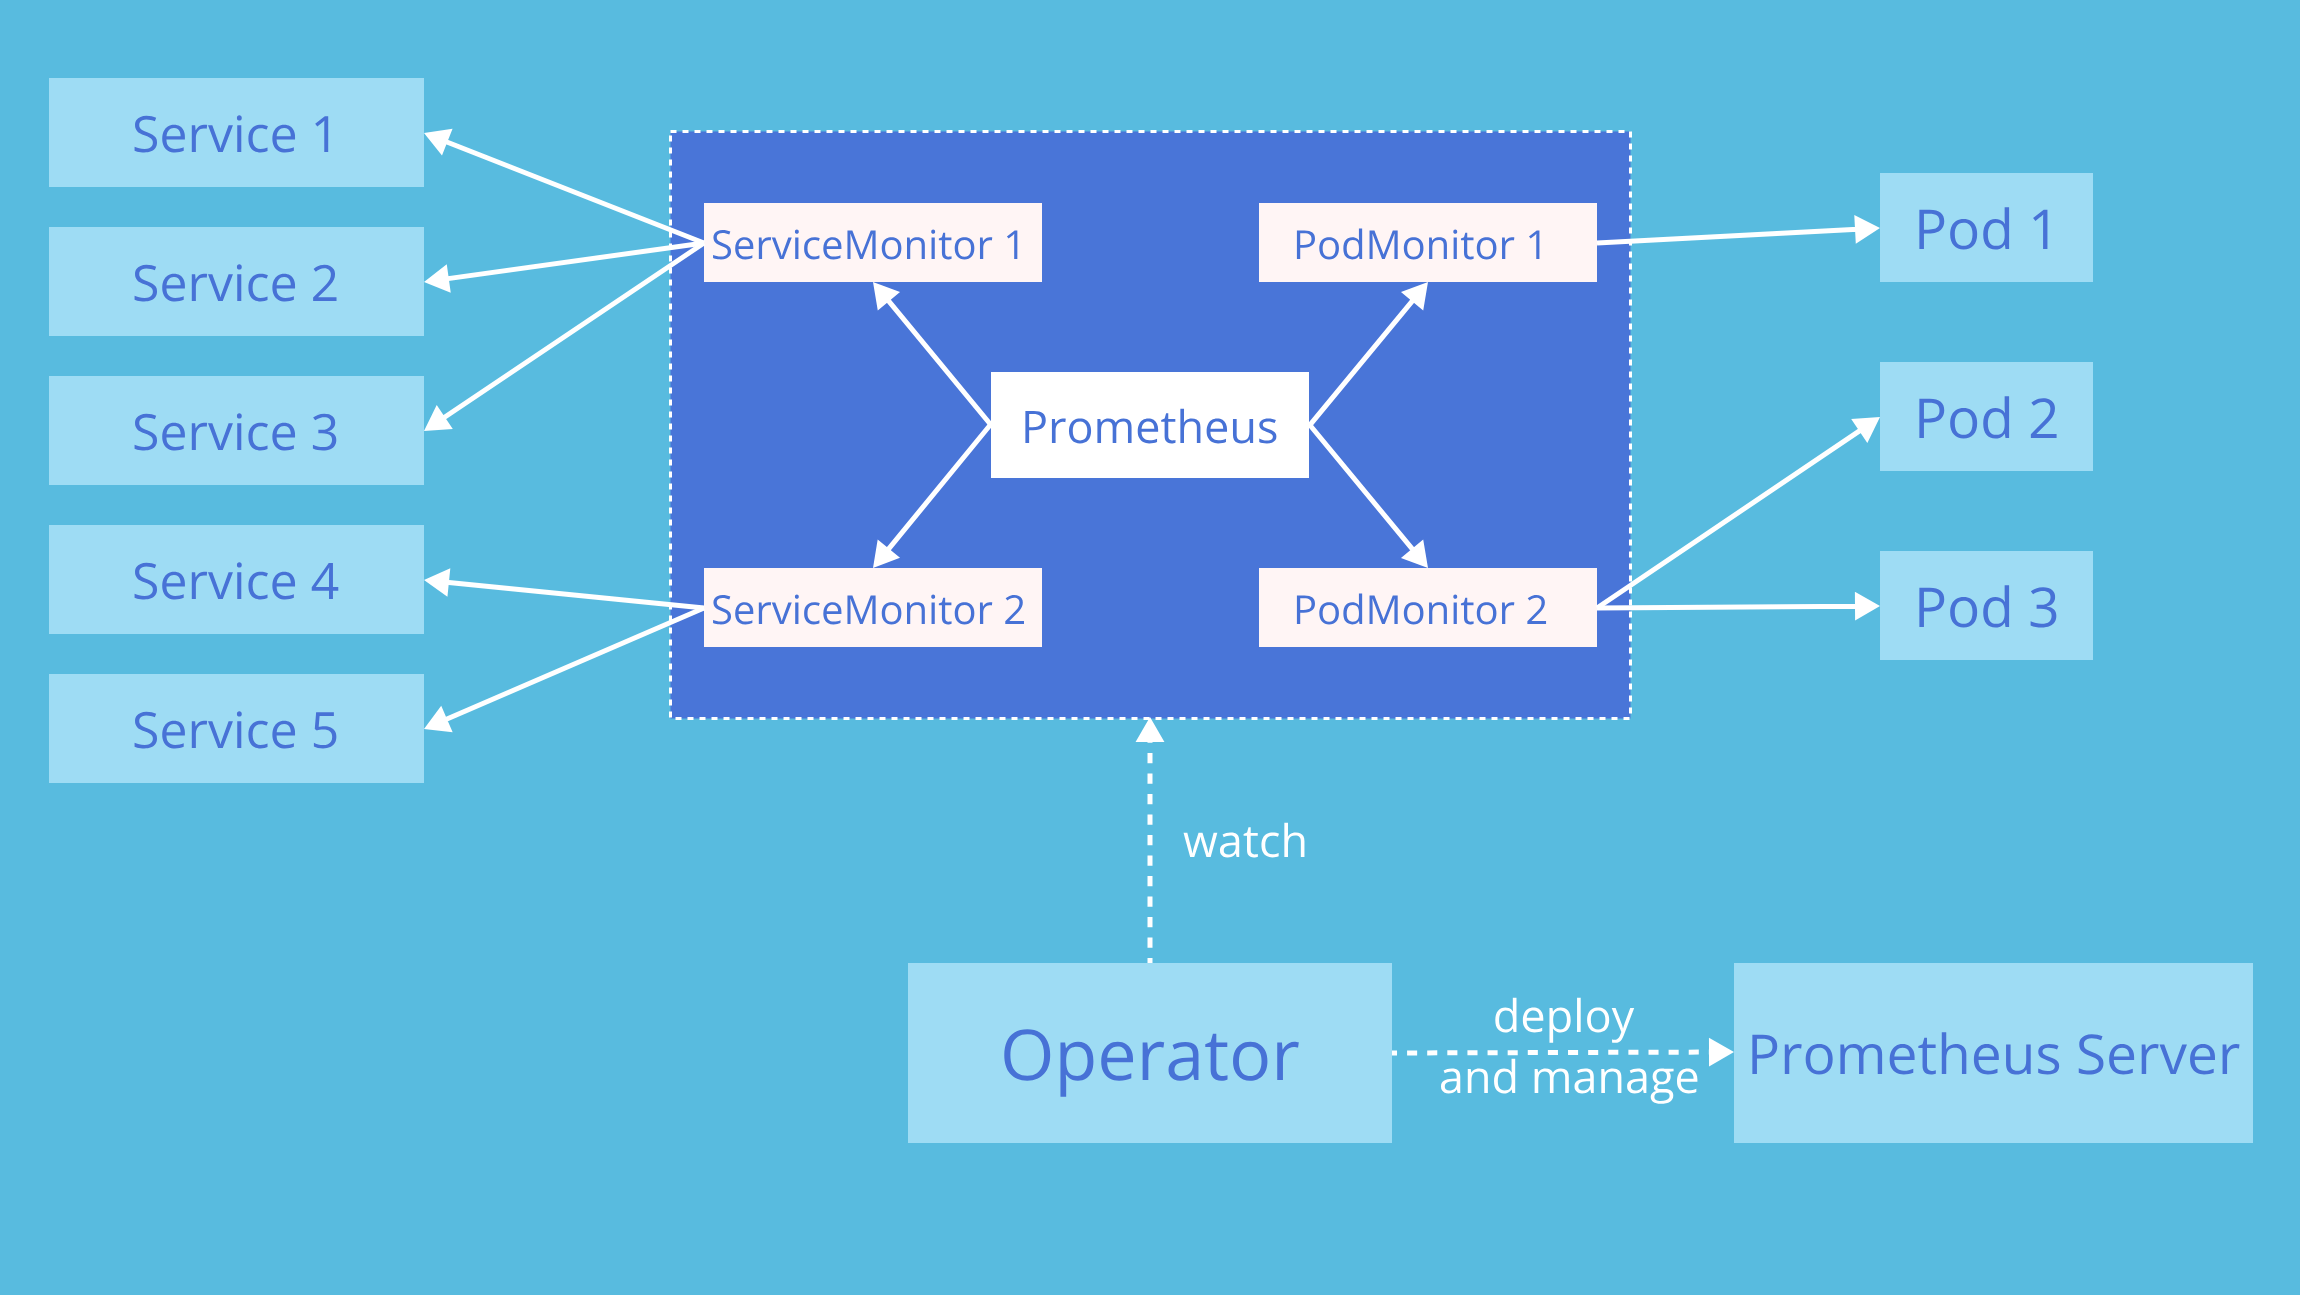
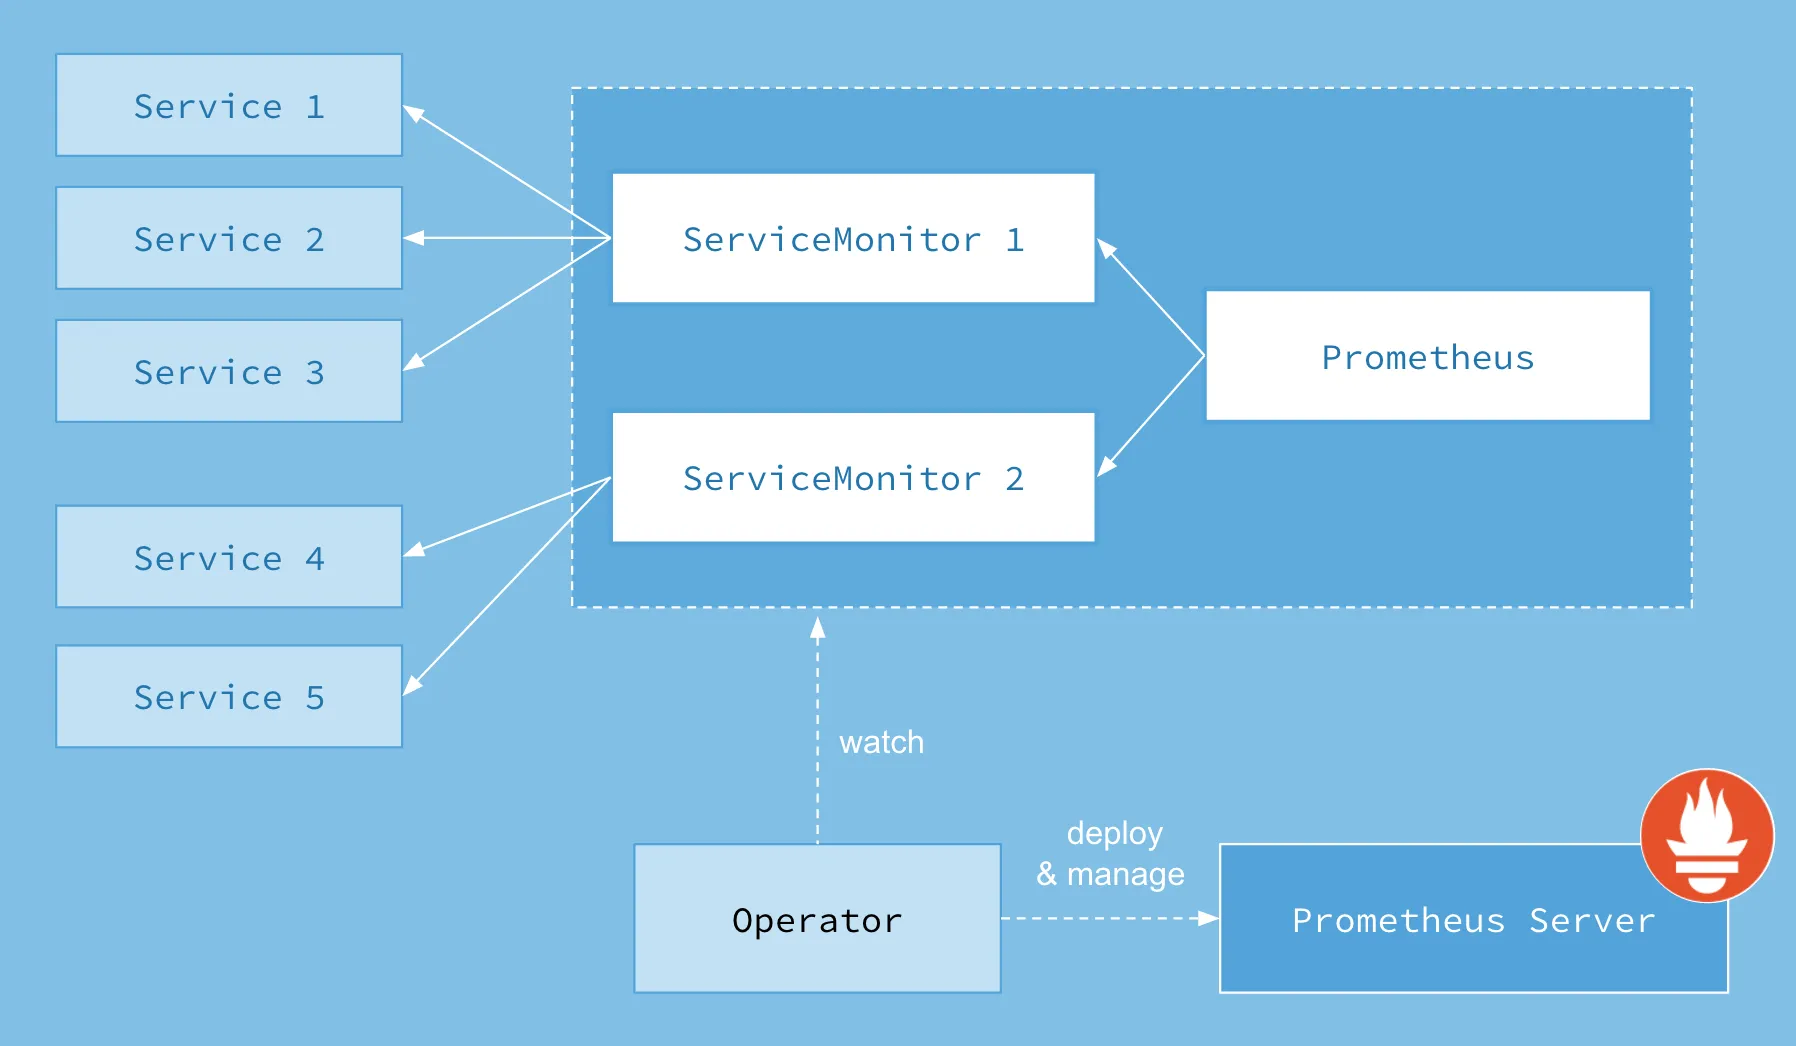
- 우리는 프로메테우스 서버를 빠르게 가동해 메트릭 수집을 시작할 수 있으며, 심지어 다른 프로메테우스 서버가 이미 개별 대상(여기서는 파드)의 메트릭 엔드포인트에서 메트릭을 긁어가고 있는 경우도 마찬가지다.
- 사실 이것이 프로메테우스를 고가용적으로 설정하는 방법으로, 동일한 대상을 긁어가는 프로메테우스 서버를 여럿 실행 할 수 있다. (그림 7.2 참조)
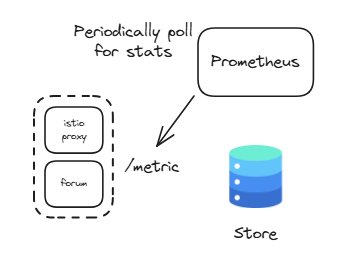
- 프로메테우스를 사용하는 이점 중 하나는 단순 HTTP 클라이언트나 웹 브라우저를 사용해 메트릭 엔드포인트를 살펴볼 수 있다는 것이다.
- 이스티오 서비스 프록시 메트릭을 프로메테우스 형식으로 노출하는 HTTP 엔드포인트를 curl 명령어로 긁어보자.
# webapp 파드 정보 확인
# istiod 파드에 tcp LISTEN port 정보 확인
kubectl exec -it deploy/webapp -n istioinaction -c istio-proxy -- netstat -tnl
Active Internet connections (only servers)
Proto Recv-Q Send-Q Local Address           Foreign Address         State
tcp        0      0 127.0.0.1:15000         0.0.0.0:*               LISTEN
tcp        0      0 127.0.0.1:15004         0.0.0.0:*               LISTEN
tcp        0      0 0.0.0.0:15090           0.0.0.0:*               LISTEN
tcp        0      0 0.0.0.0:15090           0.0.0.0:*               LISTEN
tcp        0      0 0.0.0.0:15001           0.0.0.0:*               LISTEN
tcp        0      0 0.0.0.0:15001           0.0.0.0:*               LISTEN
tcp        0      0 0.0.0.0:15006           0.0.0.0:*               LISTEN
tcp        0      0 0.0.0.0:15006           0.0.0.0:*               LISTEN
tcp        0      0 0.0.0.0:15021           0.0.0.0:*               LISTEN
tcp        0      0 0.0.0.0:15021           0.0.0.0:*               LISTEN
tcp6       0      0 :::8080                 :::*                    LISTEN
tcp6       0      0 :::15020                :::*                    LISTEN


# 앞서 살펴본 /stats 을 프로메테우스 형식으로 출력 : 서비스 프록시가 프로메테우스 메트릭을 노출하는 15090 포트로 curl 실행 확인
## /stats 는 istio-proxy 가 수집한 통계정보 출력. 디버깅/모니터링 용도. /reset_counters 로 초기화
## /stats/prometheus 는 istio-proxy 가 수집한 통계정보를 prometheus에 제공하기 위한 exporter endpoint. /reset_counters 로 초기화 할 수 없음
kubectl exec -it deploy/webapp -c istio-proxy -n istioinaction -- curl localhost:15090/stats
kubectl exec -it deploy/webapp -c istio-proxy -n istioinaction -- curl localhost:15090/stats/prometheus
...

kubectl exec -it deploy/webapp -c istio-proxy -n istioinaction -- curl localhost:15020/metrics
...- 프로메테우스가 예상하는 형식으로 된 메트릭 목록이 보인다.
- 이스티오 프록시가 주입된 모든 애플리케이션은 자동으로 이런 프로메테우스 메트릭을 노출한다.

- 15090 : Exposes Envoy proxy metrics such as xDS stats, connection stats, HTTP stats, outlier stats, health check stats, circuit-breaker stats, and so on.
- 15020 : Exposes a variety of functionalities, the main ones being as follows:
- Aggregating and exposing the metrics of the Envoy proxy by querying metrics from port 15090, application metrics (if configured), and its own metrics.
- Health-checking the Envoy and DNS proxies. The proxy can be configured to perform health checking of the application on this endpoint as well, but this is generally only used for non-Kubernetes workloads such as virtual machines.
- Endpoints for debugging the pilot agent—useful for Istio development teams—that expose information such as memory information, CPU profiling, and so on.
소개 : Prometheus is an open-source systems monitoring and alerting toolkit originally built at SoundCloud
- a multi-dimensional data model with time series data(=TSDB, 시계열 데이터베이스) identified by metric name and key/value pairs
- PromQL, a flexible query language to leverage this dimensionality
- no reliance on distributed storage; single server nodes are autonomous - Docs
- time series collection happens via a pull model over HTTP - Q&A ⇒ 질문 Push 와 Pull 수집 방식 장단점?
- pushing time series is supported via an intermediary gateway
- targets are discovered via service discovery or static configuration
- multiple modes of graphing and dashboarding support
구성 요소
- the main Prometheus server which scrapes and stores time series data
- client libraries for instrumenting application code
- a push gateway for supporting short-lived jobs
- special-purpose exporters for services like HAProxy, StatsD, Graphite, etc.
- an alertmanager to handle alerts
- various support tools
Metrics
- 메트릭은 일반인이 이해하기 쉬운 수치적 측정입니다. 시계열이라는 용어는 시간에 따른 변화를 기록하는 것을 말합니다. 사용자가 측정하고자 하는 것은 애플리케이션마다 다릅니다. 웹 서버의 경우 요청 시간이 될 수 있고, 데이터베이스의 경우 활성 연결 또는 활성 쿼리 수가 될 수 있습니다.
- Metrics are numerical measurements in layperson terms. The term time series refers to the recording of changes over time. What users want to measure differs from application to application. For a web server, it could be request times; for a database, it could be the number of active connections or active queries, and so on.
프로메테우스 3.0 출시 : 2.0, 2.18 버전 대비 처리 성능(CPU/Mem) 향상 - Blog , DevOcean , GeekNews , Youtube
7.3.1 Setting up Prometheus and Grafana 프로메테우스와 그라파나 설정 : kube prometheus stack 설치 - Github
- kube-prometheus-stack 프로젝트의 목적은 ‘프로메테우스 오퍼레이터나 그라파나, Alertmanager, Node exporter, Kube API용 어댑터 등’ 부수적인 부분들을 포함해 프로메테우스의 현실적이고 고가용성인 배포 형상을 사전에 선별하고 통합하는 것이다.
- kube-prometheus-stack collects Kubernetes manifests, Grafana dashboards, and Prometheus rules combined with documentation and scripts to provide easy to operate end-to-end Kubernetes cluster monitoring with Prometheus using the Prometheus Operator.
- 이 장에서는 프로메테우스에 연결하는 방법을 다루고, 8장에서는 그라파나의 통합에 대해 설명한다.
- kube-prometheus-stack 설치 - Helm_13.13.1
#
helm repo add prometheus-community https://prometheus-community.github.io/helm-charts
helm repo update

#
cat ch7/prom-values.yaml
open ch7/prom-values.yaml

cat << EOF > prom-values-2.yaml
prometheusOperator:
  tls:
    enabled: false
  admissionWebhooks:
    patch:
      enabled: false

prometheus:
  service:
    type: NodePort
    nodePort: 30001

grafana:
  service:
    type: NodePort
    nodePort: 30002
EOF

# helm 설치
kubectl create ns prometheus
helm install prom prometheus-community/kube-prometheus-stack --version 13.13.1 \
-n prometheus -f ch7/prom-values.yaml -f prom-values-2.yaml

# 확인
helm list -n prometheus
kubectl get-all -n prometheus # krew plugin
kubectl get sts,deploy,pod,svc,ep,cm,secret -n prometheus
kubectl get crd | grep monitoring
kubectl get prometheus,servicemonitors -n prometheus

# Prometheus 접속 : Service Discovery, Target 확인
open http://127.0.0.1:30001

#
kubectl get servicemonitors -n prometheus
NAME                                                 AGE
prom-kube-prometheus-stack-grafana                   12m
prom-kube-prometheus-stack-kube-controller-manager   12m
prom-kube-prometheus-stack-operator                  12m
prom-kube-prometheus-stack-prometheus                12m


# (참고) 프로메테우스 버전 확인
kubectl exec -it sts/prometheus-prom-kube-prometheus-stack-prometheus -n prometheus -c prometheus -- prometheus --version
prometheus, version 2.24.0 (branch: HEAD, revision: 02e92236a8bad3503ff5eec3e04ac205a3b8e4fe)
...

# Grafana 접속 : admin / prom-operator
open http://127.0.0.1:30002
(참고) kube-controller-manager 메트릭 수집 설정
# https://stackoverflow.com/questions/65901186/kube-prometheus-stack-issue-scraping-metrics
docker exec -it myk8s-control-plane curl -s https://172.18.0.2:10257/metrics -k
kubectl edit svc -n kube-system prom-kube-prometheus-stack-kube-controller-manager # 10252 -> 10257로 포트 변경
...
  ports:
  - name: http-metrics
    port: 10257
    protocol: TCP
    targetPort: 10257
...
kubectl edit servicemonitors -n prometheus prom-kube-prometheus-stack-kube-controller-manager
...
spec:
  endpoints:
  - bearerTokenFile: /var/run/secrets/kubernetes.io/serviceaccount/token
    port: http-metrics
    scheme: https
    tlsConfig:
      caFile: /var/run/secrets/kubernetes.io/serviceaccount/ca.crt
      insecureSkipVerify: true
  jobLabel: jobLabel
  namespaceSelector:
    matchNames:
    - kube-system
  selector:
    matchLabels:
      app: kube-prometheus-stack-kube-controller-manager
release: prom- 새로 배포된 프로메테우스는 이스티오 워크로드를 어떻게 긁어가야 할지 모른다.
- 이스티오의 데이터 플레인과 컨트롤 플레인 메트릭을 긁어가도록 프로메테우스를 설정하는 방법을 살펴보자.
7.3.2 Configuring the Prometheus Operator to scrape the Istio control plane and workloads
이스티오 컨트롤 플레인과 워크로드를 긁어가도록 프로메테우스 오퍼레이터 설정하기
- 프로메테우스가 이스티오에서 메트릭을 수집하도록 설정하기 위해 프로메테우스 오퍼레이터의 커스텀 리소스 ServiceMonitor 와 PodMonitor 를 사용할 것이다.
- 이 커스텀 리소스들은 프로메테우스 오퍼레이터 리포지터리의 설계 문서에서 자세히 설명하고 있다.

이스티오 컨트롤 플레인 구성 요소를 긁어오도록 ServiceMonitor 리소스를 설정하는 방법은 다음과 같다.
# cat ch7/service-monitor-cp.yaml
apiVersion: monitoring.coreos.com/v1
kind: ServiceMonitor
metadata:
  name: istio-component-monitor
  namespace: prometheus
  labels:
    monitoring: istio-components
    release: prom
spec:
  jobLabel: istio
  targetLabels: [app]
  selector:
    matchExpressions:
    - {key: istio, operator: In, values: [pilot]}
  namespaceSelector:
    any: true
  endpoints:
  - port: http-monitoring # 15014
interval: 15s이 ServiceMonitor를 적용해 컨트롤 플레인 수집을 시작해보자.
#  istiod의 Service Spec ServiceMonitor 에서 selector 에 istio=pilot 매칭 확인
kubectl describe svc istiod -n istio-system
Name:                     istiod
Labels:                   app=istiod
                          ...
                          istio=pilot
...
Port:                     http-monitoring  15014/TCP
TargetPort:               15014/TCP
Endpoints:                10.10.0.7:15014
...

#
kubectl get pod -n istio-system -l istio=pilot
NAME                      READY   STATUS    RESTARTS   AGE
istiod-7df6ffc78d-826zx   1/1     Running   0          52m

# ServiceMonitor 적용
kubectl apply -f ch7/service-monitor-cp.yaml -n prometheus

# 확인
kubectl get servicemonitor -n prometheus
NAME                                                 AGE
istio-component-monitor                              9s
prom-kube-prometheus-stack-grafana                   43m
prom-kube-prometheus-stack-kube-controller-manager   43m
prom-kube-prometheus-stack-operator                  43m
prom-kube-prometheus-stack-prometheus                43m

#
kubectl get svc,ep istiod -n istio-system
kubectl exec -it netshoot -- curl -s istiod.istio-system:15014/metrics
kubectl exec -it netshoot -- curl -s istiod.istio-system:15014/metrics | grep pilot_xds
kubectl exec -it netshoot -- curl -s istiod.istio-system:15014/metrics | grep citadel
프로메테우스 웹 확인 : Service Discovery, Targets
데이터 플레인 수집 활성화 : PodMonitor 리소스를 사용해 istio-proxy 컨테이너를 포함하는 모든 파드에서 메트릭을 수집하자
#
kubectl describe pod -n istioinaction
...
Annotations:      ...
                  prometheus.io/path: /stats/prometheus
                  prometheus.io/port: 15020
                  prometheus.io/scrape: true

#
cat ch7/pod-monitor-dp.yaml
apiVersion: monitoring.coreos.com/v1
kind: PodMonitor
metadata:
  name: envoy-stats-monitor
  namespace: prometheus
  labels:
    monitoring: istio-proxies
    release: prom
spec:
  selector:
    matchExpressions:
    - {key: istio-prometheus-ignore, operator: DoesNotExist}
  namespaceSelector:
    any: true
  jobLabel: envoy-stats
  podMetricsEndpoints:
  - path: /stats/prometheus
    interval: 15s
    relabelings:
    - action: keep
      sourceLabels: [__meta_kubernetes_pod_container_name]
      regex: "istio-proxy"
    - action: keep
      sourceLabels: [__meta_kubernetes_pod_annotationpresent_prometheus_io_scrape]
    - sourceLabels: [
    __address__, __meta_kubernetes_pod_annotation_prometheus_io_port]
      action: replace
      regex: ([^:]+)(?::\d+)?;(\d+)
      replacement: $1:$2
      targetLabel: __address__
    - action: labeldrop
      regex: "__meta_kubernetes_pod_label_(.+)"
    - sourceLabels: [__meta_kubernetes_namespace]
      action: replace
      targetLabel: namespace
    - sourceLabels: [__meta_kubernetes_pod_name]
      action: replace
      targetLabel: pod_name

# PodMonitor 설정 적용
kubectl apply -f ch7/pod-monitor-dp.yaml -n prometheus

#
kubectl get podmonitor -n prometheus
NAME                  AGE
envoy-stats-monitor   6s

# metric 확인을 위해서 호출테스트
for in in {1..10}; do curl -s http://webapp.istioinaction.io:30000/ ; sleep 0.5; done
for in in {1..10}; do curl -s http://webapp.istioinaction.io:30000/api/catalog ; sleep 0.5; done

# 반복 접속
while true; do curl -s http://webapp.istioinaction.io:30000/api/catalog ; date "+%Y-%m-%d %H:%M:%S" ; sleep 1; echo; done


#
WEBAPP=$(kubectl get pod -n istioinaction -l app=webapp -o jsonpath='{.items[0].status.podIP}')
kubectl exec -it netshoot -- curl -s $WEBAPP:15020/stats/prometheus
...
kubectl exec -it netshoot -- curl -s $WEBAPP:15090/stats/prometheus
...
프로메테우스 웹 확인 : Service Discovery, Targets ⇒ istio_request 쿼리문 입력 확인
7.4 Customizing Istio’s standard metrics
들어가며 : 엔보이 표준 메트릭 - 메트릭, 디멘션, 속성
- 이번 장 초반부에서는 서비스 간 통신에서 기본적으로 활성화되는 이스티오의 표준 메트릭 몇 가지를 소개했다.
- 표 7.1에는 표준 메트릭이 나열돼 있다 - Docs
| 메트릭 | 설명 |
| istio_requests_total | COUNTER, 요청이 들어올 때마다 증가 |
| istio_request_duration_milliseconds | DISTRIBUTION, 요청 지속 시간이 분포 |
| istio_request_bytes | DISTRIBUTION, 요청 바디 크기의 분포 |
| istio_response_bytes | DISTRIBUTION, 응답 바디 크기의 분포 |
| istio_request_messages_total | (gRPC) COUNTER, 클라이언트에게서 메시지가 올 때마다 증가 |
| istio_response_messages_total | (gRPC) COUNTER, 서버가 메시지를 보낼 때마다 증가 |
- 이스티오 엔보이 프록시 사이드카에 몇 가지 플러그인을 사용해 메트릭이 표시, 커스터마이징, 생성되는 방법을 제어한다.
- 이번 절에서는 이 플러그인을 자세히 살펴본다. 하지만 그에 앞서 세 가지 주요 개념을 이해해야 한다.
- 메트릭 metric : counter, gauge, or histogram/distribution of telemetry between service calls (inbound/outbound).
- 디멘션 dimenstion
- 속성 attribute
- 메트릭이란 서비스 호출(인바운드/아웃바운드) 간 텔레메트리의 카운터나 게이지, 히스토그램/분포를 말한다.
- 예를 들어 istio_requests_total 메트릭은 서비스로 향하는(인바운드) 혹은 서비스에서 나오는(아웃바운드) 요청의 총 개수를 센다.
- 서비스에 인바운드와 아웃바운드 요청이 모두 있다면 istio_request_total 메트릭에는 항목이 2개 표시된다.
- 인바운드나 아웃바운드는 메트릭 디멘션의 예시다.
- 이스티도의 프록시에 통계를 쿼리할 때, 메트릭과 디멘션 조합마다 통계가 따로 표시된다.
- 이는 예제를 보면 명확해질 것이다.
그러나 방향만이 유일한 디멘션은 아니다. 메트릭에는 디멘션이 여럿일 수 있으며 istio_requests_total에는 다음과 같은 기본 디멘션들이 있다.
# TYPE istio_requests_total counter
istio_requests_total{
response_code="200", # 요청 세부 정보 Request details
reporter="destination", # 메트릭이 누구 관점인가? Point of view of metric
source_workload="istio-ingressgateway",
source_workload_namespace="istio-system",
source_app="istio-ingressgateway", # 호출 주제 Caller
source_version="unknown",
source_cluster="Kubernetes",
destination_workload="webapp",
destination_workload_namespace="istioinaction",
destination_app="webapp", # 호출 대상 Target of call
destination_version="unknown",
destination_service="webapp.istioinaction.svc.cluster.local",
destination_service_name="webapp",
destination_service_namespace="istioinaction",
destination_cluster="Kubernetes",
request_protocol="http",
response_flags="-",
grpc_response_status="",
connection_security_policy="mutual_tls",
source_canonical_service="istio-ingressgateway",
destination_canonical_service="webapp",
source_canonical_revision="latest",
destination_canonical_revision="latest"
} 6 # 호출 개수 Number of calls
- 이 디멘션 중 하나라도 다르면 이 메트릭의 새로운 항목으로 보인다.
- 예를 들어 응답 코드가 HTTP 500인 경우가 있다면 다른 줄에서 표시된다 (간결함을 위해 일부 디멘션은 생략).
istio_requests_total{
response_code="200", # HTTP 200 calls 호출
reporter="destination",
source_workload="istio-ingressgateway",
source_workload_namespace="istio-system",
destination_workload="webapp",
destination_workload_namespace="istioinaction",
request_protocol="http",
connection_security_policy="mutual_tls",
} 5 # Number of HTTP 200 calls 호출 개수

istio_requests_total{
response_code="500", # HTTP 500 calls 호출
reporter="destination",
source_workload="istio-ingressgateway",
source_workload_namespace="istio-system",
destination_workload="webapp",
destination_workload_namespace="istioinaction",
request_protocol="http",
connection_security_policy="mutual_tls",
} 3 # Number of HTTP 500 calls 호출 개수디멘션이 다르면 istio_requests_total 에 대해 서로 다른 2개의 항목이 보인다. 여기서는 두 메트릭 간에 response_code 디멘션이 다르다.
- 특정 메트릭에 대해 채우고 보고할 디멘션은 설정할 때 지정할 수 있다.
- 특정 디멘션의 값은 어디서 가져올까?
- 엔보이 프록시가 런타임에 갖고 있는 값인 속성에서 가져온다.
- 예를 들어 요청의 기본 속성 중 일부가 표 7.2에 나열돼 있다.
표 7.2 : 기본 엔보이 요청 속성
| 속성 | 설명 |
| request.path | URL 중 경로 부분 |
| request.url_parh | URL 중 경로 부분, 쿼리 문자열 제외 |
| request.host | URL 중 호스트 부분 |
| request.scheme | URL 중 스킴 부분(예: ‘http’) |
| request.headers | 요청 메서드 (예. ‘GET’) |
| request.referer | 요청 헤더 Referer |
| request.useragent | 요청 헤더 User agent |
| request.time | 첫 번째 바이트 수신 시간 |
| request.id | x-request-id 헤더 값에 해당하는 요청 ID |
| request.protocol | 요청 프로토콜 |
- 이것들은 엔보이에서 사용할 수 있는 요청 속성일 뿐이다. 다른 속성도 있다.
- 응답 속성 Response attributes
- 커넥션 속성 Connection attributes
- 업스트림 속성 Upstream attributes
- 메타데이터/필터 상태 속성 Metadata/filter state attributes
- 웹어셈블리 속성 Wasm attributes
- 엔보이에서 기본적으로 사용할 수 있는 속성에 어떤 것들이 있는지는 엔보이 문서를 참조하자.
- https://www.envoyproxy.io/docs/envoy/latest/intro/arch_overview/advanced/attributes#request-attributes
- 또 다른 속성 집합은 이스티오의 peer-metadata 필터(이스티오 프록시에 내장)에서 나오며, 서비스 호출의 upstream_peer와 downstream_peer 모두에서 사용할 수 있다.
- 표 7.3은 사용 가능한 속성을 보여준다.
표 7.3 : 메타데이터 교환 필터가 제공하는 이스티오 전용 속성
| 속성 | 설명 |
| name | 파드 이름 |
| namespace | 파드가 위치한 네임스페이스 |
| labels | 워크로드 레이블 |
| owner | 워크로드 소유자 |
| workload_name | 워크로드 이름 |
| platform_metadata | 접두사 키가 있는 플랫폼 메타데이터 |
| istio_version | 프록시의 버전 식별자 |
| mesh_id | 메시의 고유 식별자 |
| cluster_id | 해당 워크로드가 속한 클러스터의 식별자 |
| app_containers | 애플리케이션 컨테이너별 짧은 이름 목록 |
- 여기 있는 속성을 사용하려면 업스트림(프록시에서 나가는) 메트릭인지, 다운스트림(프록시로 들어오는) 메트릭인지 따라 upstream_peer 나 downstream_peer 를 접두사로 붙이자.
- 예를 들어, 서비스 호출자의 이스티오 프록시 버전을 보려면 downstream_peer.istio_version 을 사용하자.
- 업스트림 서비스의 클러스터를 보려면 upstream_peer.cluster_id 를 사용하자.
- 속성은 디멘션의 값을 정의하는 데 사용한다. 속성을 사용해 기존 메트릭의 디멘션을 커스터마이징하는 방법을 살펴보자.
7.4.1 Configuring existing metrics 기존 메트릭 확인 및 (디멘션) 수정 - Metrics , Docs , Docs2 (실습~)
기본적으로, 이스티오 메트릭은 이스티오를 설치할 때 설치되는 EnvoyFilter 리소스를 사용해 stats 프록시 플러그인에서 설정한다.
# 메트릭 정보 수정 시 모든 버전의 envoyfilter 에 반영(업데이트)되는지 확인해보자.
kubectl get envoyfilter -n istio-system
NAME                    AGE
stats-filter-1.13       13h # 스터디 실습에서 사용
stats-filter-1.14       13h
stats-filter-1.15       13h
stats-filter-1.16       13h
stats-filter-1.17       13h # 현재 실습 istiod 버전
tcp-stats-filter-1.13   13h
tcp-stats-filter-1.14   13h
tcp-stats-filter-1.15   13h
tcp-stats-filter-1.16   13h
tcp-stats-filter-1.17   13h

#
kubectl get envoyfilter stats-filter-1.13 -n istio-system -o yaml
...
spec:
  configPatches:
  - applyTo: HTTP_FILTER
    match:
      context: SIDECAR_OUTBOUND
      listener:
        filterChain:
          filter:
            name: envoy.filters.network.http_connection_manager
            subFilter:
              name: envoy.filters.http.router
      proxy:
        proxyVersion: ^1\.13.*
    patch:
      operation: INSERT_BEFORE
      value:
        name: istio.stats # 필터 이름
        typed_config:
          '@type': type.googleapis.com/udpa.type.v1.TypedStruct
          type_url: type.googleapis.com/envoy.extensions.filters.http.wasm.v3.Wasm
          value:
            config: # 필터 설정
              configuration:
                '@type': type.googleapis.com/google.protobuf.StringValue
                value: |
                  {
                    "debug": "false",
                    "stat_prefix": "istio"
                  }
              root_id: stats_outbound
              vm_config:
                code:
                  local:
                    inline_string: envoy.wasm.stats
                runtime: envoy.wasm.runtime.null
                vm_id: stats_outbound
...- 이 엔보이 필터는 istio.stats 라는 필터를 직접 구성한다.
- 이 필터는 통계(메트릭) 기능을 구현하는 웹어셈블리 플러그인이다. WebAssembly (Wasm) plugin.
- 이 웹어셈블리 필터는 실제로는 엔보이 코드베이스 내에서 직접 컴파일돼 NULL 가상머신에서 실행되므로, 웹어셈블리 가상머신에서 실행되지 않는다.
- 이를 웹어셈블리 가상머신에서 실행하려면 istioctl 로 설치할 때 -–setvalues.telemetry.v2.prometheus.wasmEnabled=true 플래그를 전달하거나 상응하는 IstioOperator 설정을 해야 한다.
- 웹어셈플리는 14장에서 좀 더 자세히 살펴본다.
ADDING DIMENSIONS TO EXISTING METRICS 기존 메트릭에 디멘션 추가하기
- istio_request_total 메트릭에 디멘션을 2개 추가하고 싶다고 해보자.
- 아마 추적을 강화하려는 목적으로, 업스트림 호출에서 meshId 별로 프록시의 버전이 어떤지 확인하고 싶을 수 있다.
- upstream_proxy_version 및 source_mesh_id 디멘션을 추가해보자. (추적하고 싶지 않거나 원하는 것보다 많은 정보를 생성하는 기존 디멘션을 제거할 수도 있다)
- requests_total 메트릭(istio_ 접두사를 자동 추가로 붙이지 않은 점 확인)을 특정해 속성에서 오는 디멘션 둘이 새로 포함되도록 설정하고 있다.
- 또한 request_protocol 디멘션을 제거하기도 한다. → Github_Code (DefaultStatTags)
#
cat ch7/metrics/istio-operator-new-dimensions.yaml
apiVersion: install.istio.io/v1alpha1
kind: IstioOperator
spec:
  profile: demo
  values:
    telemetry:
      v2:
        prometheus:
          configOverride:
            inboundSidecar:
              metrics:
              - name: requests_total
                dimensions: # 추가한 새 디멘션
                  upstream_proxy_version: upstream_peer.istio_version
                  source_mesh_id: node.metadata['MESH_ID']
                tags_to_remove: # 제거한 태그 목록
                - request_protocol
            outboundSidecar:
              metrics:
              - name: requests_total
                dimensions:
                  upstream_proxy_version: upstream_peer.istio_version
                  source_mesh_id: node.metadata['MESH_ID']
                tags_to_remove:
                - request_protocol
            gateway:
              metrics:
              - name: requests_total
                dimensions:
                  upstream_proxy_version: upstream_peer.istio_version
                  source_mesh_id: node.metadata['MESH_ID']
                tags_to_remove:
                - request_protocol

# 기존 설정 확인
kubectl get istiooperator installed-state -n istio-system -o yaml | grep -E "prometheus:|telemetry:" -A2
    telemetry:
      enabled: true
      v2:
--
        prometheus:
          enabled: true
          wasmEnabled: false

# 메트릭 확인 : request_protocol 디멘션이 메트릭에 있는지 먼저 확인 >> 아래 설정 적용 후에 확인 시 해당 디멘션 없이 출력됨.
# 프로메테우스 UI 에서도 확인 : istio_requests_total - Link
kubectl -n istioinaction exec -it deploy/webapp -c istio-proxy \
-- curl localhost:15000/stats/prometheus | grep istio_requests_total
...

# 설정 적용
docker exec -it myk8s-control-plane bash
----------------------------------------
# 파일 작성
cat << EOF > istio-operator-new-dimensions.yaml
apiVersion: install.istio.io/v1alpha1
kind: IstioOperator
spec:
  profile: demo
  values:
    telemetry:
      v2:
        prometheus:
          configOverride:
            inboundSidecar:
              metrics:
              - name: requests_total
                dimensions:
                  upstream_proxy_version: upstream_peer.istio_version
                  source_mesh_id: node.metadata['MESH_ID']
                tags_to_remove:
                - request_protocol
            outboundSidecar:
              metrics:
              - name: requests_total
                dimensions:
                  upstream_proxy_version: upstream_peer.istio_version
                  source_mesh_id: node.metadata['MESH_ID']
                tags_to_remove:
                - request_protocol
            gateway:
              metrics:
              - name: requests_total
                dimensions:
                  upstream_proxy_version: upstream_peer.istio_version
                  source_mesh_id: node.metadata['MESH_ID']
                tags_to_remove:
                - request_protocol
EOF

istioctl verify-install -f istio-operator-new-dimensions.yaml # 리소스별로 적용결과를 출력
istioctl install -f istio-operator-new-dimensions.yaml -y

exit
----------------------------------------

# 변경 설정 확인
kubectl get istiooperator -n istio-system installed-state -o yaml | grep -E "prometheus:" -A9
        prometheus:
          configOverride:
            gateway:
              metrics:
              - dimensions:
                  source_mesh_id: node.metadata['MESH_ID']
                  upstream_proxy_version: upstream_peer.istio_version
                name: requests_total
                tags_to_remove:
                - request_protocol

# envoyfilter "stats-filter-{stat-postfix}"도 업데이트 확인
kubectl get envoyfilter stats-filter-1.13 -n istio-system -o yaml
...
spec:
  configPatches:
  - applyTo: HTTP_FILTER
    match:
      context: SIDECAR_OUTBOUND
      listener:
        filterChain:
          filter:
            name: envoy.filters.network.http_connection_manager
            subFilter:
              name: envoy.filters.http.router
      proxy:
        proxyVersion: ^1\.13.*
    patch:
      operation: INSERT_BEFORE
      value:
        name: istio.stats
        typed_config:
          '@type': type.googleapis.com/udpa.type.v1.TypedStruct
          type_url: type.googleapis.com/envoy.extensions.filters.http.wasm.v3.Wasm
          value:
            config:
              configuration:
                '@type': type.googleapis.com/google.protobuf.StringValue
                value: |
                  {"metrics":[{"dimensions":{"source_mesh_id":"node.metadata['MESH_ID']","upstream_proxy_version":"upstream_peer.istio_version"},"name":"requests_total","tags_to_remove":["request_protocol"]}]}
              root_id: stats_outbound
              vm_config:
                code:
                  local:
                    inline_string: envoy.wasm.stats
                runtime: envoy.wasm.runtime.null
                vm_id: stats_outbound
...

# 나머지 버전에서도 업데이트 반영되었는지 확인해보자.
kubectl get envoyfilter stats-filter-1.14 -n istio-system -o yaml | grep MESH_ID
kubectl get envoyfilter stats-filter-1.15 -n istio-system -o yaml | grep MESH_ID
kubectl get envoyfilter stats-filter-1.16 -n istio-system -o yaml | grep MESH_ID
kubectl get envoyfilter stats-filter-1.17 -n istio-system -o yaml | grep MESH_ID
...- 메트릭에서 이 디멘션을 확인하기 전에 이스티오의 프록시가 이 디멘션에 대해 알게 해야 한다.
- 이렇게 하려면 디플로이먼트 파드 Spec에 sidecar.istio.io/extraStatTags 애노테이션을 달아야 한다.
- 이 애노테이션은 디폴이먼트 메타데이터가 아니라 spec.template.metadata 파드 템플릿에 추가돼야 한다는 점을 유의하자.
Note
istio 1.17+ 부터 custom dimension 에 대한 annotation (extraStatTags) 설정이 필요없어짐. -
Docs
Updated the Telemetry API to use a new native extension (stats) for Prometheus stats instead of the Wasm-based extension. This improves CPU overhead and memory usage of the feature.
Custom dimensions no longer require regex and
bootstrap annotations.
적용 해보자
#
cat ch7/metrics/webapp-deployment-extrastats.yaml
---
apiVersion: apps/v1
kind: Deployment
metadata:
  labels:
    app: webapp
  name: webapp
spec:
  replicas: 1
  selector:
    matchLabels:
      app: webapp
  template:
    metadata:
      annotations:
        proxy.istio.io/config: |-
          extraStatTags:
          - "upstream_proxy_version"
          - "source_mesh_id"
      labels:
        app: webapp
    spec:
      containers:
      - env:
        - name: KUBERNETES_NAMESPACE
          valueFrom:
            fieldRef:
              fieldPath: metadata.namespace
        image: istioinaction/webapp:latest
        imagePullPolicy: IfNotPresent
        name: webapp
        ports:
        - containerPort: 8080
          name: http
          protocol: TCP
        securityContext:
          privileged: false

#
kubectl apply -n istioinaction -f ch7/metrics/webapp-deployment-extrastats.yaml

# metric 확인을 위해서 호출테스트
for in in {1..10}; do curl -s http://webapp.istioinaction.io:30000/api/catalog ; sleep 0.5; done
while true; do curl -s http://webapp.istioinaction.io:30000/api/catalog ; date "+%Y-%m-%d %H:%M:%S" ; sleep 1; echo; done

# 메트릭 확인 : request_protocol 디멘션이 디멘션 목록에 없는 것도 확인
kubectl -n istioinaction exec -it deploy/webapp -c istio-proxy \
-- curl localhost:15000/stats/prometheus | grep istio_requests_total
istio_requests_total{reporter="destination",source_workload="istio-ingressgateway",source_canonical_service="istio-ingressgateway",source_canonical_revision="latest",source_workload_namespace="istio-system",source_principal="spiffe://cluster.local/ns/istio-system/sa/istio-ingressgateway-service-account",source_app="istio-ingressgateway",source_version="unknown",source_cluster="Kubernetes",destination_workload="webapp",destination_workload_namespace="istioinaction",destination_principal="spiffe://cluster.local/ns/istioinaction/sa/webapp",destination_app="webapp",destination_version="",destination_service="webapp.istioinaction.svc.cluster.local",destination_canonical_service="webapp",destination_canonical_revision="latest",destination_service_name="webapp",destination_service_namespace="istioinaction",destination_cluster="Kubernetes",response_code="200",grpc_response_status="",response_flags="-",connection_security_policy="mutual_tls",source_mesh_id="cluster.local",upstream_proxy_version="unknown"} 10
istio_requests_total{reporter="source",source_workload="webapp",source_canonical_service="webapp",source_canonical_revision="latest",source_workload_namespace="istioinaction",source_principal="spiffe://cluster.local/ns/istioinaction/sa/webapp",source_app="webapp",source_version="",source_cluster="Kubernetes",destination_workload="catalog",destination_workload_namespace="istioinaction",destination_principal="spiffe://cluster.local/ns/istioinaction/sa/catalog",destination_app="catalog",destination_version="v1",destination_service="catalog.istioinaction.svc.cluster.local",destination_canonical_service="catalog",destination_canonical_revision="v1",destination_service_name="catalog",destination_service_namespace="istioinaction",destination_cluster="Kubernetes",response_code="200",grpc_response_status="",response_flags="-",connection_security_policy="unknown",source_mesh_id="cluster.local",upstream_proxy_version="1.17.8"} 10
...
istio_requests_total{
  reporter="source",
  source_workload="webapp",
  source_canonical_service="webapp",
  source_canonical_revision="latest",
  source_workload_namespace="istioinaction",
  source_principal="spiffe://cluster.local/ns/istioinaction/sa/webapp",
  source_app="webapp",source_version="",
  source_cluster="Kubernetes",
  destination_workload="catalog",
  destination_workload_namespace="istioinaction",
  destination_principal="spiffe://cluster.local/ns/istioinaction/sa/catalog",
  destination_app="catalog",
  destination_version="v1",
  destination_service="catalog.istioinaction.svc.cluster.local",
  destination_canonical_service="catalog",
  destination_canonical_revision="v1",
  destination_service_name="catalog",
  destination_service_namespace="istioinaction",
  destination_cluster="Kubernetes",
  response_code="200",
  grpc_response_status="",
  response_flags="-",
  connection_security_policy="unknown",
  source_mesh_id="cluster.local", # 메시 ID
  upstream_proxy_version="1.17.8" # 업스트림 프록시
} 10프로메테우스 UI 에서 확인 : istio_requests_total - Link
(참고) Telemetry 로 istioinaction 네임스페이스에 dimension을 추가/삭제 - Blog ,
# cat ch7/metrics/v2/add-dimensions-telemetry.yaml
---
apiVersion: telemetry.istio.io/v1alpha1
kind: Telemetry
metadata:
  name: add-dimension-tags
  namespace: istioinaction
spec:
  metrics:
  - providers:
      - name: prometheus
    overrides:
      - match:
          metric: REQUEST_COUNT
          mode: CLIENT_AND_SERVER
        disabled: false
        tagOverrides:
          upstream_proxy_version:
            operation: UPSERT
            value: upstream_peer.istio_version
          source_mesh_id:
            operation: UPSERT
            value: node.metadata['MESH_ID']
          request_protocol:
            operation: REMOVE

#
kubectl apply -n istioinaction -f ch7/metrics/v2/add-dimensions-telemetry.yaml7.4.2 Creating new metrics 새로운 메트릭 만들기
- istio_requests_total 같은 기존 표준 메트릭의 디멘션을 커스터마이징하는 방법을 살펴봤다.
- 그런데 새 메트릭을 만들고 싶다면 어떻게 해야 할까?
- stats 플러그인에 새 메트릭을 정의하면 된다.
# cat ch7/metrics/istio-operator-new-metric.yaml
apiVersion: install.istio.io/v1alpha1
kind: IstioOperator
spec:
  profile: demo
  values:
    telemetry:
      v2:
        prometheus:
          configOverride:
            inboundSidecar:
              definitions:
              - name: get_calls
                type: COUNTER
                value: "(request.method.startsWith('GET') ? 1 : 0)"
            outboundSidecar:
              definitions:
              - name: get_calls
                type: COUNTER
                value: "(request.method.startsWith('GET') ? 1 : 0)"
            gateway:
              definitions:
              - name: get_calls
                type: COUNTER
                value: "(request.method.startsWith('GET') ? 1 : 0)"
- 여기서 만든 메트릭은 istio_get_calls 인데, 정의한 이름은 get_calls 라는 점을 유의하자. 앞서 언급했듯이 istio_ 접두사는 자동으로 붙는다.
- 이 메트릭을 COUNTER로 정의했지만 GAUGE 나 HISTOGRAM도 선택할 수 있다. 메트릭의 값은 CEL Common Expression Language 표현식인 문자열로, COUNTER 타입에 정수를 반환해야 한다. https://github.com/google/cel-spec
- CEL 표현식은 속성에 대해 작동하여, 여기서는 HTTP GET 요청 개수를 센다.
- 이 설정을 적용해 istio_get_calls 라는 새 메트릭을 만들어보자.
# 설정 적용
docker exec -it myk8s-control-plane bash
----------------------------------------
cat << EOF > istio-operator-new-metric.yaml
apiVersion: install.istio.io/v1alpha1
kind: IstioOperator
spec:
  profile: demo
  values:
    telemetry:
      v2:
        prometheus:
          configOverride:
            inboundSidecar:
              definitions:
              - name: get_calls
                type: COUNTER
                value: "(request.method.startsWith('GET') ? 1 : 0)"
            outboundSidecar:
              definitions:
              - name: get_calls
                type: COUNTER
                value: "(request.method.startsWith('GET') ? 1 : 0)"
            gateway:
              definitions:
              - name: get_calls
                type: COUNTER
                value: "(request.method.startsWith('GET') ? 1 : 0)"
EOF

istioctl verify-install -f istio-operator-new-metric.yaml # 리소스별로 적용결과를 출력
istioctl install -f istio-operator-new-metric.yaml -y

exit
----------------------------------------

# 확인
kubectl get istiooperator -n istio-system installed-state -o yaml  | grep -A2 get_calls$
              - name: get_calls
                type: COUNTER
                value: '(request.method.startsWith(''GET'') ? 1 : 0)''
...

kubectl get envoyfilter -n istio-system stats-filter-1.13 -o yaml | grep get_calls
...
{"definitions":[{"name":"get_calls","type":"COUNTER","value":"(request.method.startsWith('GET') ? 1 : 0)"}]}
...앞 절에서는 새 디멘션은 이스티오 프록시에 명시적으로 알려야 했다. 새 메트릭을 만들때는 프록시에 노출하라고 이스티오에 알려아 한다. → 1.17 안해도됨
# webapp 디플로이먼트의 파드 사양에 애너테이션을 추가한다
cat ch7/metrics/webapp-deployment-new-metric.yaml
...
  template:
    metadata:
      annotations:
        proxy.istio.io/config: |-
          proxyStatsMatcher:
            inclusionPrefixes:
            - "istio_get_calls"
      labels:
        app: webapp
...

#
kubectl -n istioinaction apply -f ch7/metrics/webapp-deployment-new-metric.yaml호출 테스트 후 새 메트릭 확인
# metric 확인을 위해서 호출테스트
for in in {1..10}; do curl -s http://webapp.istioinaction.io:30000/api/catalog ; sleep 0.5; done
while true; do curl -s http://webapp.istioinaction.io:30000/api/catalog ; date "+%Y-%m-%d %H:%M:%S" ; sleep 1; echo; done

# 메트릭 확인
kubectl -n istioinaction exec -it deploy/webapp -c istio-proxy -- curl localhost:15000/stats/prometheus | grep istio_get_calls
# TYPE istio_get_calls counter
istio_get_calls{} 20프로메테우스 UI 확인 : istio_get_calls - Link
- 이 메트릭에는 어떤 디멘션도 지정하지 않았다. 보고 싶은 디멘션을 맞춤 설정하고 싶다면 앞 절의 단계를 따르면 된다.
- 여기서는 시스템 내 모든 요청 중 GET 요청의 개수를 세려고 한다. 이는 새로운 메트릭을 생성하는 기능의 힘을 보여주기 위해 고안한 예제다.
- catalog 서비스의 /items 엔드포인트로 향하는 모든 GET 요청의 개수를 세고 싶다면 어떻게 해야 할까?
- 이스티오 stats 플러그인을 사용하면 할 수 있다.
- 새로운 디멘션과 속성을 만들어 더 세분화할 수 있다. 다음 절에서 알아보자.
7.4.3 Grouping calls with new attributes 새 속성으로 호출 그룹화하기
- 기존 속성을 기반으로 더 세분화하거나 도메인에 특화해 새 속성을 만들 수 있다.
- 예를 들어 istio_operationId 라는 새 속성을 만들 수 있다.
- 이 속성은 request.path_url 과 request.method 를 조합해 catalog 서비스의 /items API로 가는 GET 호출 개수를 추적하려는 것이다.
- 이를 위해 이스티오 attribute-gen 프록시 플러그인을 사용하는데, 이 플러그인은 프록시 메트릭의 동작을 개조하는 데 사용하는 또 다른 웹어셈블리 Wasm extension 확장이다.
- attribute-gen 플러그인은 앞 절에서 사용했던 stats 플러그인을 보완하는 역할을 한다.
- attribute-gen 플러그인은 stats 플러그인 보다 먼저 적용되기 때문에 이 플러그인이 만들어내는 모든 속성을 stats 에서 사용할 수 있다.
- EnvoyFilter 리소스로 attribute-gen 플러그인을 구성하는 방법을 살펴보자.
cat ch7/metrics/attribute-gen.yaml
apiVersion: networking.istio.io/v1alpha3
kind: EnvoyFilter
metadata:
  name: attribute-gen-example
  namespace: istioinaction
spec:
  configPatches:
  ## Sidecar Outbound
  - applyTo: HTTP_FILTER
    match:
      context: SIDECAR_OUTBOUND
      listener:
        filterChain:
          filter:
            name: envoy.filters.network.http_connection_manager
            subFilter:
              name: istio.stats
      proxy:
        proxyVersion: ^1\.13.*
    patch:
      operation: INSERT_BEFORE
      value:
        name: istio.attributegen
        typed_config:
          '@type': type.googleapis.com/udpa.type.v1.TypedStruct
          type_url: type.googleapis.com/envoy.extensions.filters.http.wasm.v3.Wasm
          value:
            config:
              configuration:
                '@type': type.googleapis.com/google.protobuf.StringValue
                value: |
                  {
                    "attributes": [
                      {
                        "output_attribute": "istio_operationId", # 속성 이름
                        "match": [
                         {
                           "value": "getitems", # 속성 값
                           "condition": "request.url_path == '/items' && request.method == 'GET'"
                         },
                         {
                           "value": "createitem",
                           "condition": "request.url_path == '/items' && request.method == 'POST'"
                         },
                         {
                           "value": "deleteitem",
                           "condition": "request.url_path == '/items' && request.method == 'DELETE'"
                         }
                       ]
                      }
                    ]
                  }
              vm_config:
                code:
                  local:
                    inline_string: envoy.wasm.attributegen
runtime: envoy.wasm.runtime.null- 이 설정은 기본 속성 몇 가지를 조합해서 특정 종류의 호출을 식별할 수 있는 istio_operationId 라는 새 속성을 만들어낸다.
- 여기서는 /items 라는 특정 API 로의 호출을 식별한 후 세려고 한다.
- 이 attribute-gen 플러그인을 webapp 서비스의 아웃바운드 호출에 추가해 catalog 서비스의 /items 로 향햐는 호출을 추적한다.
- 아래 attribute-gen.yaml 을 적용하기 전에 proxyVersion: ^1\\.16.* 을 설치된 istio 버전에 맞게 1.16 혹은 1.17 로 수정.
#
docker exec -it myk8s-control-plane istioctl version
client version: 1.17.8
control plane version: 1.17.8
data plane version: 1.17.8 (4 proxies)

#
vi ch7/metrics/attribute-gen.yaml # 혹은 open ch7/metrics/attribute-gen.yaml 후 수정
...
      proxy:
        proxyVersion: ^1\.17.* # 수정
...

# 버전을 수정 후 envoyfilter 를 배포합니다. envoyfilter를 배포한 네임스페이스의 istio-proxy들에 적용 됩니다
kubectl apply -f ch7/metrics/attribute-gen.yaml -n istioinaction

# 확인
kubectl get envoyfilter -n istioinaction -o yaml | kubectl neat
kubectl get envoyfilter -n istioinaction
NAME                    AGE
attribute-gen-example 12s- catalog 에 대한 API 호출을 식별하기 위해 istio_request_total 메트릭 안에 이 속성을 사용하는 새 디멘션 upstream_operator 을 추가할 것이다.
- stats 플러그인 설정을 업데이트 하자.
# 설정 적용
docker exec -it myk8s-control-plane bash
----------------------------------------
cat << EOF > istio-operator-new-attribute.yaml
apiVersion: install.istio.io/v1alpha1
kind: IstioOperator
spec:
  profile: demo
  values:
    telemetry:
      v2:
        prometheus:
          configOverride:
            outboundSidecar:
              metrics:
              - name: requests_total
                dimensions:
                  upstream_operation: istio_operationId # 새 디멘션
EOF
istioctl verify-install -f istio-operator-new-attribute.yaml # 리소스별로 적용결과를 출력
istioctl install -f istio-operator-new-attribute.yaml -y

exit
----------------------------------------

# 확인 : outboundSidecar 에만 적용됨
kubectl get istiooperator -n istio-system installed-state -o yaml | grep -B2 -A1 istio_operationId$
              metrics:
              - dimensions:
                  upstream_operation: istio_operationId
                name: requests_total

#
kubectl get envoyfilter -n istio-system stats-filter-1.17 -o yaml | kubectl neat
...
spec:
  configPatches:
  - applyTo: HTTP_FILTER
    match:
      context: SIDECAR_OUTBOUND
      listener:
        filterChain:
          filter:
            name: envoy.filters.network.http_connection_manager
            subFilter:
              name: envoy.filters.http.router
      proxy:
        proxyVersion: ^1\.17.*
    patch:
      operation: INSERT_BEFORE
      value:
        name: istio.stats
        typed_config:
          '@type': type.googleapis.com/udpa.type.v1.TypedStruct
          type_url: type.googleapis.com/stats.PluginConfig
          value:
            metrics:
            - dimensions:
                upstream_operation: istio_operationId
              name: requests_total
...

kubectl get envoyfilter -n istio-system stats-filter-1.16 -o yaml | grep istio_operationId -B15 -A5
kubectl get envoyfilter -n istio-system stats-filter-1.15 -o yaml | grep istio_operationId -B15 -A5
kubectl get envoyfilter -n istio-system stats-filter-1.14 -o yaml | grep istio_operationId -B15 -A5
kubectl get envoyfilter -n istio-system stats-filter-1.13 -o yaml | grep istio_operationId -B15 -A5
...새 디멘션을 사용할 때는 서비스의 extraStats 애노테이션에도 추가해야 한다. ← 안해도됨
호출 후 확인
# metric 확인을 위해서 호출테스트
for in in {1..10}; do curl -s http://webapp.istioinaction.io:30000/api/catalog ; sleep 0.5; done
while true; do curl -s http://webapp.istioinaction.io:30000/api/catalog ; date "+%Y-%m-%d %H:%M:%S" ; sleep 1; echo; done

# 메트릭 확인 : dimension (upstream_operation) 추가 확인!
kubectl -n istioinaction exec -it deploy/webapp -c istio-proxy -- curl localhost:15000/stats/prometheus | grep istio_requests_total
istio_requests_total{reporter="destination",source_workload="istio-ingressgateway",source_canonical_service="istio-ingressgateway",source_canonical_revision="latest",source_workload_namespace="istio-system",source_principal="spiffe://cluster.local/ns/istio-system/sa/istio-ingressgateway-service-account",source_app="istio-ingressgateway",source_version="unknown",source_cluster="Kubernetes",destination_workload="webapp",destination_workload_namespace="istioinaction",destination_principal="spiffe://cluster.local/ns/istioinaction/sa/webapp",destination_app="webapp",destination_version="",destination_service="webapp.istioinaction.svc.cluster.local",destination_canonical_service="webapp",destination_canonical_revision="latest",destination_service_name="webapp",destination_service_namespace="istioinaction",destination_cluster="Kubernetes",request_protocol="http",response_code="200",grpc_response_status="",response_flags="-",connection_security_policy="mutual_tls"} 10
istio_requests_total{reporter="source",source_workload="webapp",source_canonical_service="webapp",source_canonical_revision="latest",source_workload_namespace="istioinaction",source_principal="spiffe://cluster.local/ns/istioinaction/sa/webapp",source_app="webapp",source_version="",source_cluster="Kubernetes",destination_workload="catalog",destination_workload_namespace="istioinaction",destination_principal="spiffe://cluster.local/ns/istioinaction/sa/catalog",destination_app="catalog",destination_version="v1",destination_service="catalog.istioinaction.svc.cluster.local",destination_canonical_service="catalog",destination_canonical_revision="v1",destination_service_name="catalog",destination_service_namespace="istioinac
프로메테우스 UI : istio_requests_total{upstream_operation!=""} - Link 쿼리(빈 문자열 아닌 경우) , istio_requests_total 쿼리 - istio_requests_total
- 새 디멘션이 추가됐으며, 이로써 이번 장을 마무리한다.
- 애플리케이션 간에 네트워크를 통한 통신이 늘어날수록 문제가 발생할 가능성이 더 높아진다는 것을 알아야 한다.
- 누가 애플리케이션을 작성했든, 무슨 언어를 사용했든 상관없이 서비스 간에 무슨 일이 일어나고 있는지에 한결같은 시야를 갖는 것은 마이크로서비스 스타일 아키텍처를 운영하는 데 필수 조건이나 마찬가지다.
- 이스티오는 서비스 간 메트릭 수집을 더 쉽게 만드는데, 개발자가 애플리케이션에 명시적으로 코딩하지 않아도 성공률, 실패율, 재시도 횟수, 지연 시간 등을 관찰하기 때문이다.
- 이들은 분명히 필요하며, 이스티오는 다만 황금 신호 네트워크 메트릭 수집을 간편하게 만들 뿐이다. (구글 SRE 책은 지연 시간, 처리량, 오류, 포화도를 황금 신호 메트릭으로 지칭한다)
- https://sre.google/sre-book/monitoring-distributed-systems/
- golden-signal metrics: latency, throughput, errors, and saturation.
- 이번 장에서는 이스티오 서비스 프록시(엔보인 프록시)와 컨트롤 플레인에서 메트릭을 긁어오는 방법, 노출된 메트릭을 확장하는 방법, 프로메테우스 같은 시계열 시스템에 메트릭을 집계하는 방법을 다뤘다.
- 다음 장에서 살펴보겠지만, 이와 같은 내용을 바당으로 그라파나나 키알리를 사용해 메트릭을 시각화할 수 있다.
Summary
- 모니터링은 알려진 바람직하지 않은 상태를 관찰하기 위해 메트릭를 수집하고 집계하여 수정 조치를 취할 수 있도록 하는 과정입니다.
- Monitoring is the process of collecting and aggregating metrics to watch for known undesirable states so that corrective measures can be taken.
- Istio는 사이드카 프록시에서 요청을 가로챌 때 모니터링에 사용되는 메트릭을 수집합니다. 프록시는 7계층(애플리케이션 네트워킹 계층)에서 작동하기 때문에 메트릭에 사용할 수 있는 상태 코드, HTTP 메서드, 헤더 등 다양한 정보에 액세스할 수 있습니다.
- Istio collects the metrics used for monitoring when intercepting requests in the sidecar proxy. Because the proxy acts at layer 7 (the application-networking layer), it has access to a great deal of information such as status codes, HTTP methods, and headers that can be used in metrics.
- 핵심 지표 중 하나는 istio_requests_total로, 요청을 카운트하고 상태 코드 200으로 끝나는 요청 수와 같은 질문에 답합니다.
- One of the key metrics is istio_requests_total, which counts requests and answers questions such as how many requests ended with status code 200.
- 프록시에 의해 노출된 지표는 관측 가능한 시스템을 구축하는 기초를 마련합니다.
- The metrics exposed by the proxies set the foundation to build an observable system.
- 메트릭 수집 시스템은 프록시에서 노출된 메트릭을 수집하고 집계합니다.
- Metrics-collection systems collect and aggregate the exposed metrics from the proxies.
- 기본적으로 Istio는 프록시가 제한된 통계 집합만 표시하도록 구성합니다. meshConfig .defaultConfig를 사용하거나 주석 proxy.istio .io/config를 사용하여 워크로드 단위로 더 많은 메쉬 전체를 보고하도록 프록시를 구성할 수 있습니다.
- By default, Istio configures the proxies to expose only a limited set of statistics. You can configure the proxies to report more mesh-wide using the meshConfig .defaultConfig or on a per-workload basis using the annotation proxy.istio .io/config.
- 컨트롤 플레인에는 성능에 대한 지표도 표시됩니다. 가장 중요한 것은 프록시에 변경 사항을 배포하는 데 걸리는 시간을 측정하는 히스토그램 파일럿_proxy_convergence_time입니다.
- The control plane also exposes metrics for its performance. The most important is the histogram pilot_proxy_convergence_time, which measures the time taken to distribute changes to the proxies.
- IstioOperator를 사용하여 Istio에서 사용할 수 있는 메트릭을 사용자 지정하고 프록시 구성을 정의하는 주석 proxy.istio.io/config 에서 extraStats 값을 설정하여 서비스에 사용할 수 있습니다. 이러한 수준의 제어는 운영자(최종 사용자)가 스크래핑되는 원격 측정과 대시보드에 표시하는 방법에 대한 유연성을 제공합니다.
- We can customize the metrics available in Istio using the IstioOperator and use them in services by setting the extraStats value in the annotation proxy.istio.io/config that defines the proxy configuration. This level of control gives the operator (end user) flexibility over what telemetry gets scraped and how to present it in dashboards.